
- While the means are about equal, males exhibit greater variability in intelligence scores than females. Statistically, this results in a higher frequency of males at the extreme ends of the distribution.
- Females generally perform better on tests of verbal fluency, spelling, and writing, as well as tasks requiring clerical speed, accuracy, and short-term memory.
- Visual-spatial ability is the largest and most consistent difference, favoring males. The advantage is most acute in mental rotation—the ability to mentally manipulate 3D objects in an imaginary space.
- Male-female STEM degree and spatial ability disparities were greater in the most gender-egalitarian countries, suggesting that the influence of socio-cultural factors diminishes and biology’s role increases as conditions become more equal.
Background
Long story short, women and men do not differ much, if at all, on average g-factor scores, but there are differences in certain cognitive abilities that may be relevant to education, vocational choice, and success in various walks of life.
Because cognitive sex differences are generally much smaller than racial or social-class differences, they are highly sensitive to sampling errors. Consequently, the representation of male and female examinees in a study must be reasonably representative of males and females in the relevant country. At a minimum, the male:female ratio in the sample should be roughly equal to the likely male:female ratio in the population. Failure to meet this requirement indicates that an unknown recruitment effect may be distorting the results. An unfortunate number of the studies on which Lynn and Irwing (2004) base their case do not meet this criterion, and therefore, their general conclusion is limited.
One reason there may be performance differences on any test is motivation. However, compelling results from a well-designed, comprehensive study of motivation on intelligence test scores indicate a negligible to minor influence (~2.5 IQ points), based on six studies with a combined sample size of 4,2081. One particular view claims that some groups perform poorly on tests because they are threatened by common stereotypes, such as the belief that girls cannot do math. Research on stereotype threat, however, has not held up well2; meta-analyses find that the effects are generally small or nonexistent. Consider what Diane Halpern (1986)3 had to say in the preface to the first edition of her classic book Sex Differences in Cognitive Abilities:
It seemed like a simple task when I started writing this book. … At the time it seemed to me that any between-sex differences in thinking abilities were due to socialization practices, artifacts and mistakes in the research, and bias and prejudice. After reviewing a pile of journal articles that stood several feet high, and numerous books and chapters that dwarfed the stack of the journal articles, I changed my mind. The task I had undertaken certainly wasn’t simple and the conclusions that I had expected to make had to be revised.
General Intelligence Differences
Standardized test batteries, such as the Stanford-Binet and Wechsler scales use item-level analysis to remove items that show evidence of bias, where questions measure differences irrelevant to the intended construct. As a result, final composite scores are designed to reflect the target cognitive constructs as fairly as possible across groups. Still, slight differences between the sexes remain after this process.
Test Batteries
Analyses of the adult standardization samples of the WAIS-III and WAIS-R generally show a small average difference in IQ in favor of men. The results are consistent across countries, running from 2–3 IQ points in the United States and Canada4 (in deviation units, d = 0.19) to 4 points (d = 0.27) in China5 and Japan6. These results are also close to those obtained in earlier studies, showing consistency over time7.
However, summary scores on the WAIS, such as Full Scale, Verbal, and Performance (FSIQ, VIQ, PIQ), are calculated as weighted combinations of subtest scores. If men have higher scores on some subtests and women on others, then, depending on the weights assigned to each subtest, you could produce a summary score that favors men over women, or vice versa, simply by manipulating the weights. And it is certainly true that if a test battery omits an important ability on which there are male–female differences, then the balance of men’s and women’s scores in an overall index will be different from what it would have been had the omitted ability been evaluated[tk img].
Arthur Jensen (1998)8 argued that the way out of this dilemma is to compare men and women on g-factor scores. To that end, Jensen designed a technique called the method of correlated vectors (MCV) that tests Charles Spearman's hypothesis, that is, it tests whether group differences on tests are mainly due to differences in g (a latent trait) as opposed to differences in specific factors or specific tests. When MCV is applied to standard test batteries such as the Wechsler's, it shows that the magnitude of the sex difference across subtests is unrelated to the tests’ g-loadings, which suggests that the minor average sex difference in IQ scores cannot be attributed to the g-factor. It should be noted that multigroup confirmatory factor analysis (MGCFA) provides much more stable and reliable results than MCV by explicitly testing for measurement invariance and allowing comparison between two hypotheses, rather than merely evaluating the weaker statement that a single hypothesis is better than a chance description of the data.
Individual Tests
In theory, a way to study male–female differences while avoiding the problem of having to justify the composition of a test battery would be to look at men’s and women’s scores on a single test of pure g, rather than a composite, and compare the scores obtained in an accurate sample of a large population, such as the population of a country, where the possibility of differential recruitment of men and women into the population would not be at issue. However, no single pure measure of g actually exists; the closest are progressive matrix tests, which have been shown on factor analyses to have the highest g loadings and the lowest loadings on any of the group factors.
The most widely used matrix test, the Raven’s Progressive Matrices (RPM), nevertheless contains a significant visuospatial reasoning component in most populations9. As documented later on, there are moderate to large male–female differences in some types of visuospatial reasoning. Thus, items may be somewhat biased because they require some degree of visuospatial processing. If this is indeed the case, controlling for sex differences in visuospatial ability would eliminate the sex differences on the RAPM test. Colom and colleagues (2004)10 reported that this is indeed the case: men outperformed women in the RAPM and in the mental rotation test from the Primary Mental Abilities Battery. However, the men’s average advantage on the RAPM vanished when differences in visuospatial ability were statistically removed. Moreover, biased items that create other differences may be identified and removed through applying differential item functioning (DIF) methods.
Given these findings, the lack of average g-factor differences in large, well-designed studies of test batteries takes on even greater weight. The most likely conclusion is that there are no reliable average sex differences in the general factor of intelligence (g). The theoretical importance of this is that it suggests that the true sex differences reside in the modular aspects of brain functioning rather than in whatever general conditions of the brain’s information-processing capacity cause positive correlations among all of the modular functions on which there is normal variation and which account for the existence of g.
Greater Male Variability
An important, well-established sex difference is that men’s scores on measures of general intelligence are more variable than women’s scores. A variance difference is typically reflected in respective standard deviations, a measure of the scatter or variability of scores around the mean of a distribution. This variance difference implies that there will be differences between men and women at both extremes of the intelligence distribution, even if there is no mean difference (see the Gender Calculator for a visualization). Differences at the extremes will be exacerbated if there is a mean difference, even a small one. The figure below demonstrates the implications of a sex difference in variance in general intelligence using a theoretical adult distribution based on the empirical finding of a 5-15% larger deviation in IQ for men in comparison to women11.
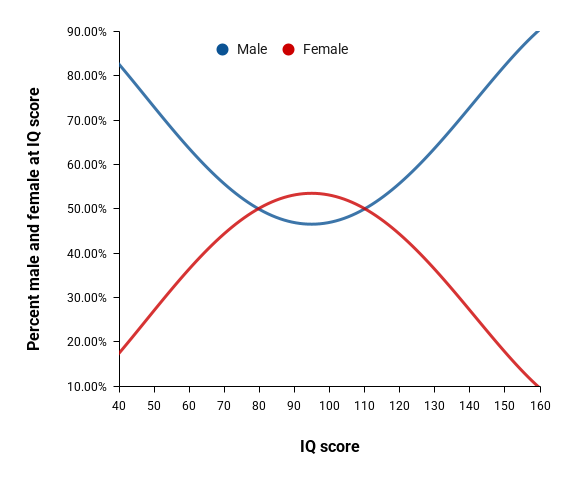
This example illustrates that combination of a slight difference in variances have very little effect on the distribution of (in this case) intelligence test scores across men and women in the “generally normal” range, say, from IQ equivalents of 85–115, which is where ~68 percent of all scores lie, but can produce substantial differences in the frequencies of men and women among the top and bottom deviations. Empirical support for this pattern comes from large, nationally representative samples, such as the 1932 Scottish Mental Survey of more than 80,000 eleven-year-olds, which found similar mean scores for boys and girls but greater male variance (SD = 14.9 vs. 14.1), resulting in male overrepresentation at both extremes of the distribution12.
The greater male variability hypothesis states that human males generally display greater variability in traits than human females do.
Special Education
Greater male variability results in boys outnumbering girls in special education programs, like programs for gifted students as well as students on the other end of the spectrum. For the former, this was true in the Study of Mathematically Precocious Youth (SMPY)13 begun at the Johns Hopkins University (see wiki section for more). Part of this study involved three different cohorts that could be described as being in the top 1 in 100, 1 in 200, and 1 in 10,000 in the distribution of SAT scores. The corresponding male:female ratios were 1.5:1 (most recent), 2.1:1, and 11.2:1 (original). Statistically, the expected male:female ratio in the 1 in 10,000 (about 156 IQ) cohort should be ~3.5:1, while the most recent cohort has an approximately expected ratio; this shift likely reflects increased educational opportunities for women. The observed male:female ratio in special education classes (left tail of the distribution) is also higher than expected on the basis of differences in variance alone. The following section explains why this may be.
Origin of Male Variability
Wendy Johnson and her colleagues (2008)14 at the University of Edinburgh have suggested a reason for the overrepresentation of males at the low end of the distribution. They assumed that the distribution of intelligence actually consists of two distributions: a distribution of the intelligence of normally developing individuals, which is centered slightly above the IQ = 100 point, and a distribution of individuals who have been subjected to either biological or environmental disturbances that disrupt normal development. This distribution, which is considerably smaller than the first, is centered on the IQ = 80 point. Assuming that both distributions have a standard deviation of 15 IQ points, about 75 percent of the individuals in the disrupted group would have IQs above 70 (70 IQ being a usual criterion for the mentally disabled). Therefore, the disrupted-development population would consist largely of people whose intelligence was in the low-normal range, rather than the pathological range. Johnson and colleagues further assumed that more males than females fall into the disrupted-development population. This is consistent with considerable other data showing that males are generally more at risk for biological disruption and perinatal accidents than females.
X Chromosome
Johnson and her colleagues (2009)15 also pointed out that greater male variability would be expected if the (largely yet unidentified) genes for general intelligence are located on the X chromosome, because the male genetic potential would then depend on a smaller, and hence more variable, sample of the alleles for intelligence than would be the case for women, with two X chromosomes. The assumption is not unreasonable, as we know that genes that lead to severe cognitive pathologies are overrepresented on the X chromosome. A direct test of the hypothesis will have to wait until the genes underlying normal variation in genetic potential are finally located. Johnson and colleagues’ assumptions are sufficient to account for deviations from the normal distribution in low scores from two Scottish surveys of intelligence in eleven-year-olds, conducted in 1932 and 1947. Similar excesses of low scores have been observed in other data sets.
Specific Cognitive Abilities
Although there is at most a minuscule average difference between men and women in general intelligence test scores, there are substantial average differences along some of the dimensions of intelligence.
The table below shows male–female standard deviation unit (d) scores for effect size for different aspects of intelligence. The results are from four national surveys of people who were tested in high school and have since been followed through their early adult careers16. While there is some discrepancy in the results, which is probably due to differences in content across tests, two trends stand out. Women do better than men in tests of reading comprehension, speed of simple perceptual operations, and tests of associative memory, in which examinees have to recall arbitrary associations, such as associating a picture and a number. Men do better than women on tests of visuospatial reasoning and mathematics.
| Survey code | Test date | N | Reading | Math | Abstract reasoning | Spatial | Perceptual speed | Associative memory |
|---|---|---|---|---|---|---|---|---|
| Project Talent | 1960 | 73,425 | -0.15 | 0.12 | 0.04 | 0.13 | n.a. | -0.32 |
| NLS-72 | 1972 | 16,860 | -0.05 | 0.24 | -0.22 | n.a. | -0.23 | -0.26 |
| HS&B | 1980 | 25,069 | 0.002 | 0.22 | n.a. | 0.25 | -0.21 | -0.18 |
| NLSY79 | 1980 | 11,914 | -0.18 | 0.26 | n.a. | n.a. | -0.43 | n.a. |
| NELS:88 | 1992 | 24,599 | -0.09 | 0.03 | n.a. | n.a. | n.a. | n.a. |
Note. n.a. = not applicable. Data are from Hedges and Nowell (1995, tables 1 and 2)16.
These conclusions refer to broadly defined abilities. Some psychometric research studies provide further detail. The Differential Aptitude Battery (DAT) is a battery of tests developed by the Educational Testing Service (ETS) for research purposes. Adult male–female differences are consistent among samples from the United States, Spain, and the United Kingdom17. Women do somewhat better on tests of language skills (verbal fluency, spelling, and writing, as opposed to reasoning about verbally presented material) and on tests of speed and accuracy in simple operations. The former advantage is often observed from an early age due to females' more rapid language development[tk]. Men do markedly better on tests involving the manipulation of visual images. Men also do slightly better on tests of verbal and abstract reasoning.
Spatial Ability
Both the national surveys and the psychometric research studies indicate that the biggest differences between men and women are on perceptual and visuospatial reasoning tasks – the P and R dimensions of the g-VPR model. Laboratory studies amplify these results. Men tend to be better than women at tasks involving the manipulation of mental images. The prototypical example is a mental rotation task, in which two figures must be compared by moving them about “in the mind’s eye.” Women take longer to do this, on average, and make more errors. Examples are shown in the figure below. Men also do better than women on tasks involving judgment of real or imagined motion3 18.

Assuming a half-standard-deviation difference on a rotation task (d = 0.5), we would still expect 30 percent of the women to outperform 50 percent of the men, with this difference being more pronounced at higher levels of performance, given the aforementioned variability ratios.
It should be noted that general intelligence is a far better predictor of performance than rotational ability, even though both are important. People can apply general intelligence to develop a problem-solving strategy that suits their particular cognitive strengths and compensates for their weaknesses.
Origins
An integrative framework for determining the origins of sex differences in cognitive abilities was proposed by Halpern (2000)3. Its focus is on biological, psychological, and social influences.
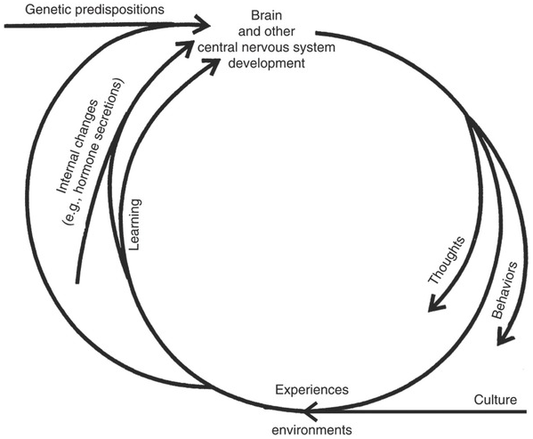
Accordingly, the whole nature-versus-nurture debate appears to be an unwarranted oversimplification that departs from what the available scientific evidence shows so far. The biopsychosocial model, on the other hand, supports a continuous loop in which the factors involved are closely linked.
Gender-Equality Paradox
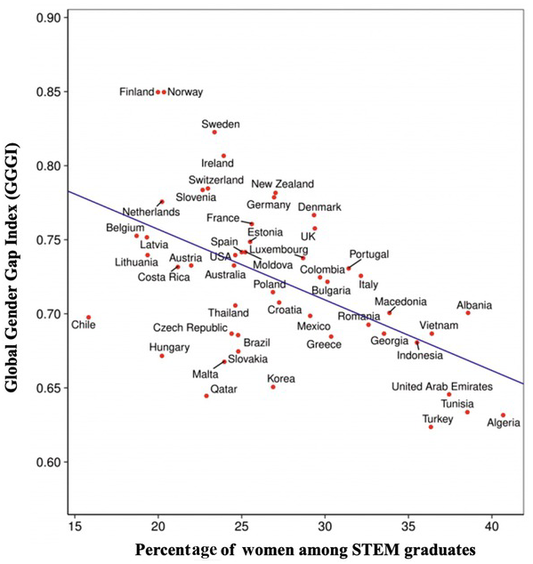
Are academic and career interests mostly influenced by the sociocultural milieu and/or by biological differences? There is at least data to test whether the degree of gender equality in nations is related to male–female disparities in STEM fields. If social and cultural variables really do/can exert major influences on career choices, it is reasonable to expect that more gender equality will be associated with smaller STEM disparities. This is because, generally, gender-equal countries give more educational and empowerment opportunities and do more to promote STEM fields to girls and women. However, just the opposite was found. STEM degree disparities were greater in the most egalitarian countries19(see next figure).
Stoet and Geary (2013)20 obtained PISA scores for reading comprehension, math, and science literacy from 472,242 students in sixty- seven nations or regions, such as Hong Kong and Macao. Consistent with previous analyses of PISA data, across countries, boys generally scored better on math, and girls scored better on reading comprehension and science literacy. Each country was also scored on the Global Gender Gap Index (GGGI), which is based on fourteen key indicators of male–female differences (e.g., earnings, life expectancy, seats in national legislatures). Higher GGGI scores indicate greater gender equality. Many other variables were also assessed (e.g., career interests, degrees obtained). See relevant figure below19.
Explanations for this paradoxical finding are unclear, but one plausible explanation is that, when given a fair choice, women prefer family over career and participate in STEM careers less than their abilities might predict, likely due to their biological predispositions. This would be consistent with findings from the SMPY13 longitudinal studies, which surveyed participants' interests, careers, and family lives.
Additionally, sex differences in both mental rotation and line angle judgment performance tended to be larger in gender egalitarian and economically developed nations than in less egalitarian and less developed nations3.
Hormones
A vast research literature from animals and humans indicates that genetic potential interacts with hormonal balance during key periods of brain development to cause sex differences in behavior and cognition. For example, manipulation of adrenal levels prenatally and postnatally can influence the display of typical male or typical female behavior in rats, including the extent of engagement in rough-and-tumble play and the patterns of behavior in maze exploration. This experiment would be particularly unethical in humans, so instead, certain medical conditions in which unusual hormonal concentrations occur are studied.
Congenital adrenal hyperplasia (CAH) is a genetic condition in which the adrenal gland fails to generate a key enzyme, causing unusual sensitivity to male hormones. The condition can occur in both boys and girls. It is treated by restoring the normal hormone balance. Female CAH patients tend to have higher scores on spatial orientation tests than normal females. Males with CAH (a less-studied group) tend to have lower scores than normal males. There are indications that this result generalizes to other behavior patterns in women, for female CAH patients display more masculine behaviors and interests than do normal girls and women, including such things as preferences for male-appropriate toys18.
Circulating hormonal levels in adults will also influence human cognition. In women, high circulating estrogen levels facilitate tasks involving verbal fluency and/or short-term memory. The evidence is mixed regarding visuospatial reasoning, except for a consistent reduction in performance on mental rotation tasks. This has been established by two sources of data: studies of women tested at various times during their menstrual cycle21 and studies of postmenopausal women who either are or are not receiving estrogen replacement therapy3. Complementary results have been found in studies of testosterone. Testosterone appears to have a nonmonotonic effect on visuospatial reasoning, enhancing it in women and men with low testosterone (a common condition in the elderly), but decreasing it in men with normal or high testosterone levels. The cognitive effects are complicated by the fact that circulating testosterone levels are associated with a myriad of other effects, including increases in impulsivity and aggressive behavior. Ultimately, in visuospatial problem solving, a hormonal effect could be on either the brain mechanisms required for the task itself or the brain mechanisms involved in selecting a problem-solving strategy18.
References
Bates, T. C., & Gignac, G. E. (2022). Effort impacts IQ test scores in a minor way: A multi-study investigation with healthy adult volunteers. Intelligence, 92(1), 101652. https://www.pure.ed.ac.uk/ws/portalfiles/portal/267487584/BatesGignacIntellitence2022EffortImpacts.pdf ↩︎
Flore, P. C., Mulder, J., & Wicherts, J. M. (2018). The influence of gender stereotype threat on mathematics test scores of Dutch high school students: A registered report. Comprehensive Results in Social Psychology, 3(5), 140–174. https://www.researchgate.net/publication/330739611_The_influence_of_gender_stereotype_threat_on_mathematics_test_scores_of_Dutch_high_school_students_a_registered_report ↩︎
Halpern, D. F. (2012). Sex differences in cognitive abilities (3rd ed.). Psychology Press. ↩︎ ↩︎ ↩︎ ↩︎ ↩︎
Longman, R. S., Saklofske, D. H., & Fung, T. S. (2007). WAIS-III percentile scores by education and sex for U.S. and Canadian populations. Assessment, 14(4), 426–432. https://pubmed.ncbi.nlm.nih.gov/17986660/ ↩︎
Dai, X., Ryan, J. J., Paolo, A. M., & Harrington, R. G. (1991). Sex differences on the Wechsler Adult Intelligence Scale—Revised for China. Psychological Assessment: A Journal of Consulting and Clinical Psychology, 3(2), 282–284. https://psycnet.apa.org/doi/10.1037/1040-3590.3.2.282 ↩︎
Hattori, K., & Lynn, R. (1997). Male–female differences on the Japanese WAIS-R. Personality and Individual Differences, 23(3), 531–533. https://doi.org/10.1016/S0191-8869(97)80021-9 ↩︎
Matarazzo, J. D., Bornstein, R. A., McDermott, P. A., & Noonan, J. V. (1986). Verbal IQ vs. performance IQ difference scores in males and females from the WAIS-R standardization sample. Journal of Clinical Psychology, 42(6), 965–974. https://doi.org/10.1002/1097-4679(198611)42:6%3C965::AID-JCLP2270420621%3E3.0.CO;2-I ↩︎
Jensen, A. R. (1998). The g factor: The science of mental ability. Praeger. https://arthurjensen.net/ ↩︎
Johnson, W., & Bouchard, T. J., Jr. (2005). The structure of human intelligence: It is verbal, perceptual, and image rotation (VPR), not fluid and crystallized. Intelligence, 33(4), 393–416. https://psycnet.apa.org/doi/10.1016/j.intell.2004.12.002 ↩︎
Colom, R., Escorial, S., & Rebollo, I. (2004). Sex differences on the Progressive Matrices are influenced by sex differences on spatial ability. Personality and Individual Differences, 37(6), 1289–1293. https://doi.org/10.1016/j.paid.2003.12.014 ↩︎
Warne, R. T. (2020). Males and Females Have the Same Distribution of IQ Scores. In In the Know: Debunking 35 Myths about Human Intelligence (pp. 239–246). chapter, Cambridge: Cambridge University Press. ↩︎
Deary, I. J., Thorpe, G., Wilson, V., Starr, J. M., & Whalley, L. J. (2003). Population sex differences in IQ at age 11: The Scottish mental survey 1932. Intelligence, 31(6), 533–542. https://doi.org/10.1016/S0160-2896(03)00053-9 ↩︎
Benbow, C. P., Lubinski, D., & Stanley, J. C. (1996). Intellectual talent: Psychometric and social issues. Johns Hopkins University Press. https://gwern.net/doc/iq/high/smpy/1996-benbow-intellectualtalentpsychometricandsocialissues.pdf ↩︎ ↩︎
Johnson, W., Carothers, A., & Deary, I. J. (2008). Sex Differences in Variability in General Intelligence: A New Look at the Old Question. Perspectives on psychological science : a journal of the Association for Psychological Science, 3(6), 518–531. https://doi.org/10.1111/j.1745-6924.2008.00096.x ↩︎
Johnson, W., Carothers, A., & Deary, I. J. (2009). A Role for the X Chromosome in Sex Differences in Variability in General Intelligence?. Perspectives on psychological science : a journal of the Association for Psychological Science, 4(6), 598–611. https://doi.org/10.1111/j.1745-6924.2009.01168.x ↩︎
Hedges, L. V., & Nowell, A. (1995). Sex differences in mental test scores, variability, and numbers of high-scoring individuals. Science (New York, N.Y.), 269(5220), 41–45. https://doi.org/10.1126/science.7604277 ↩︎ ↩︎
Strand, S., Deary, I. J., & Smith, P. (2006). Sex differences in cognitive abilities test scores: a UK national picture. The British journal of educational psychology, 76(Pt 3), 463–480. https://doi.org/10.1348/000709905X50906 ↩︎
Stoet, G., & Geary, D. C. (2013). Sex differences in mathematics and reading achievement are inversely related: within- and across-nation assessment of 10 years of PISA data. PloS one, 8(3), e57988. https://doi.org/10.1371/journal.pone.0057988 ↩︎ ↩︎
Stoet, G., & Geary, D. C. (2018). The Gender-Equality Paradox in Science, Technology, Engineering, and Mathematics Education. Psychological science, 29(4), 581–593. https://doi.org/10.1177/0956797617741719 ↩︎
Hausmann, M., Slabbekoorn, D., Van Goozen, S. H., Cohen-Kettenis, P. T., & Güntürkün, O. (2000). Sex hormones affect spatial abilities during the menstrual cycle. Behavioral neuroscience, 114(6), 1245–1250. https://doi.org/10.1037//0735-7044.114.6.1245 ↩︎