IQ is one of the most studied constructs in psychology and one of the most misunderstood among laypeople. This article addresses common misconceptions using large-scale empirical evidence, the result of over a century of study. Since it is quite lengthy, it is suggested that the reader use the right sidebar to navigate to topics relevant to their inquiry.
It is recommended that readers first understand what IQ tests measure, psychometric g. This article is a good introduction to understanding the general factor of intelligence.
General
"IQ tests only measure how good you are at taking IQ tests."
- IQ scores are one of the single best predictors of various real-world outcomes, such as educational attainment, job performance, and academic performance.
- The predictive power of psychometric g for job performance increases as job complexity increases. Across all jobs, the correlation is ~.5, with the academic performance correlation being about the same.
- Controls for parental socioeconomic status demonstrate that the abilities IQ tests measure are highly causal of all these various outcomes and measures of success.
- IQ scores are also correlated with many biological variables such as brain size, brain glucose metabolic rate, the latency and amplitude of cortical-evoked potentials, and brain nerve conduction velocity.
- IQ tests capture a broad general ability that generalizes beyond test-taking skill into how efficiently people learn and function in the real world.
The claim that "IQ tests only measure how good you are at taking IQ tests" collapses when you put it up against a century's worth of predictive-validity research. Scores on IQ tests generalize far beyond just "IQ tests", anticipating how easily people learn, solve novel problems, and translate knowledge into real-world results.
Meta‑analytic work spanning more than 82,000 students demonstrates that measures of general cognitive ability (g) are among the single strongest predictors of classroom achievement- outperforming emotional intelligence, socioeconomic background, and conscientiousness. Jensen points out in The g Factor:
The correlation of IQ with grades and achievement test scores is highest (.60 to .70) in elementary school, which includes virtually the entire child population and hence the full range of mental ability. At each more advanced educational level, more and more pupils from the lower end of the IQ distribution drop out, thereby restricting the range of IQs. The average validity coefficients decrease accordingly: high school (.50 to .60), college (.40 to .50), graduate school (.30 to .40).
Arthur Jensen, The g Factor, p. 2781
g's relationship to scholastic performance is consistently positive and sizeable, but the strength of that relationship diminishes as you move up the educational ladder. This is not due to any change in the psychology of intelligence, but rather an expected statistical phenomenon known as range restriction (lower-IQ students exit the pipeline earlier, so the remaining pool becomes a specific, restricted sample, and correlations naturally shrink when variance on one variable is artificially limited). However, even the attenuated graduate-level correlations (.30-.40) are, by the standards of educational psychology, impressively high. See here in our glossary for a helpful guide to what constitutes a weak or large (or common or rare) correlation in individual differences research.
This is supported by a review of 70 independent samples (2004)2, who report a corrected true‑score correlation of r = .39 between scores on the g‑loaded Miller Analogies IQ Test and cumulative graduate GPA, with an even higher r = .41 for first‑year GPA; g correlations climbed to r = .58 for comprehensive exam scores and remained substantial for faculty ratings (r = .37) and supervisor‑rated job performance (r = .41). These magnitudes comfortably sit in the mid‑.30s to mid‑.40s (and higher) range that characterize g's predictive power across educational settings2. As summarized by Professor Russell Warne in In the Know (2020), higher IQ students "learn more rapidly, learn more efficiently, organize and generalize information more spontaneously, and make fewer errors than their average or below-average classmates" (Warne, 170)3.
The same pattern appears in employment. As shown in Figure 1 below, "scores on cognitive ability tests are strongly related to success in occupational training in both civilian and military jobs, with meta-analytic estimates ranging from the high .30s to 70s (Ones et al., 2005)"4. Across every occupation, results from IQ tests are a reliable predictor of a range of outcomes, from job effectiveness and leadership success to judgments of creativity.
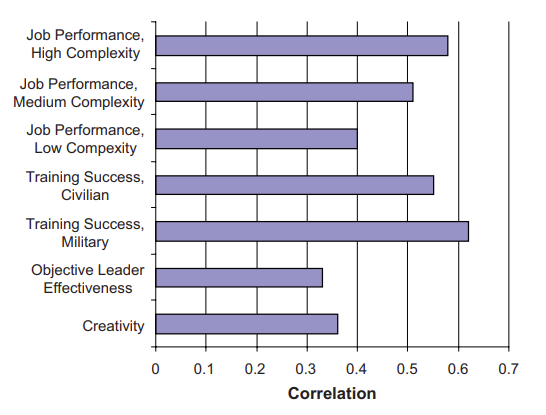
A landmark meta-analysis showed that general mental ability correlates about r ≈ .58 with performance in the most complex jobs and r ≈ .23-.51 in less complex roles. An updated review of 100 years of selection research puts the mean validity of g at roughly .50 across all jobs5.
A longitudinal meta-analysis that followed more than 80,000 people from childhood or adolescence into established adulthood found that pre-19 IQ scores predict occupational status at r ≈ .45 and income at r ≈ .23 when outcomes are measured after age 29. Importantly, the same review confirmed the r ≈ .51 IQ to job performance correlation reported by Schmidt & Hunter, showing how early cognitive ability foreshadows how well people work. These translate into large economic gains for organizations because smarter employees master training faster, make fewer errors, and sustain higher productivity.6
Beyond school and work, IQ measured in childhood forecasts later income, occupational status, and employment stability (and much more, as the next figure suggests). We have good reason to believe that all these strong correlations are highly causal, with higher IQ causing success in a vast array of domains, because the correlations do not significantly decrease when parental socioeconomic status (SES) is statistically controlled for1. As Strenze's (2007) longitudinal meta-analysis7 concludes (p. 246):
Comparison of the relative importance of SES and intelligence shows that, in the American sample, the influence of intelligence is, at every step, stronger than that of SES – intelligence has a much stronger impact on educational attainment (model I) and manages also to have a much stronger impact on occupational attainment when education is controlled for (model II) and on income when both education and occupation are controlled for (model III).
In other words, it means that most people with high mental abilities get a good education but those who do not can still get a high-status occupation thanks to their mental abilities and those who do not get either good education or high-status occupation can still earn a lot of money thanks to their mental abilities (the same is also true for SES but to a much lesser degree).
As such, a substantial part of the status inequality within families is related to IQ differences within families. This is seen in a study8 which found that the discrepancy between fathers’ and sons’ adult occupational status correlated .368 with the difference in their IQs. Sons with IQs higher than their fathers’ IQs tended to attain higher occupational levels than their fathers, and sons with lower IQs than their fathers’ generally fell below their fathers’ occupational levels. The author concludes that intelligence produces variation in persons’ occupational attainments that is unrelated to the status of their family origin.
The figure below summarizes the relationship between intelligence and many measures of success9.
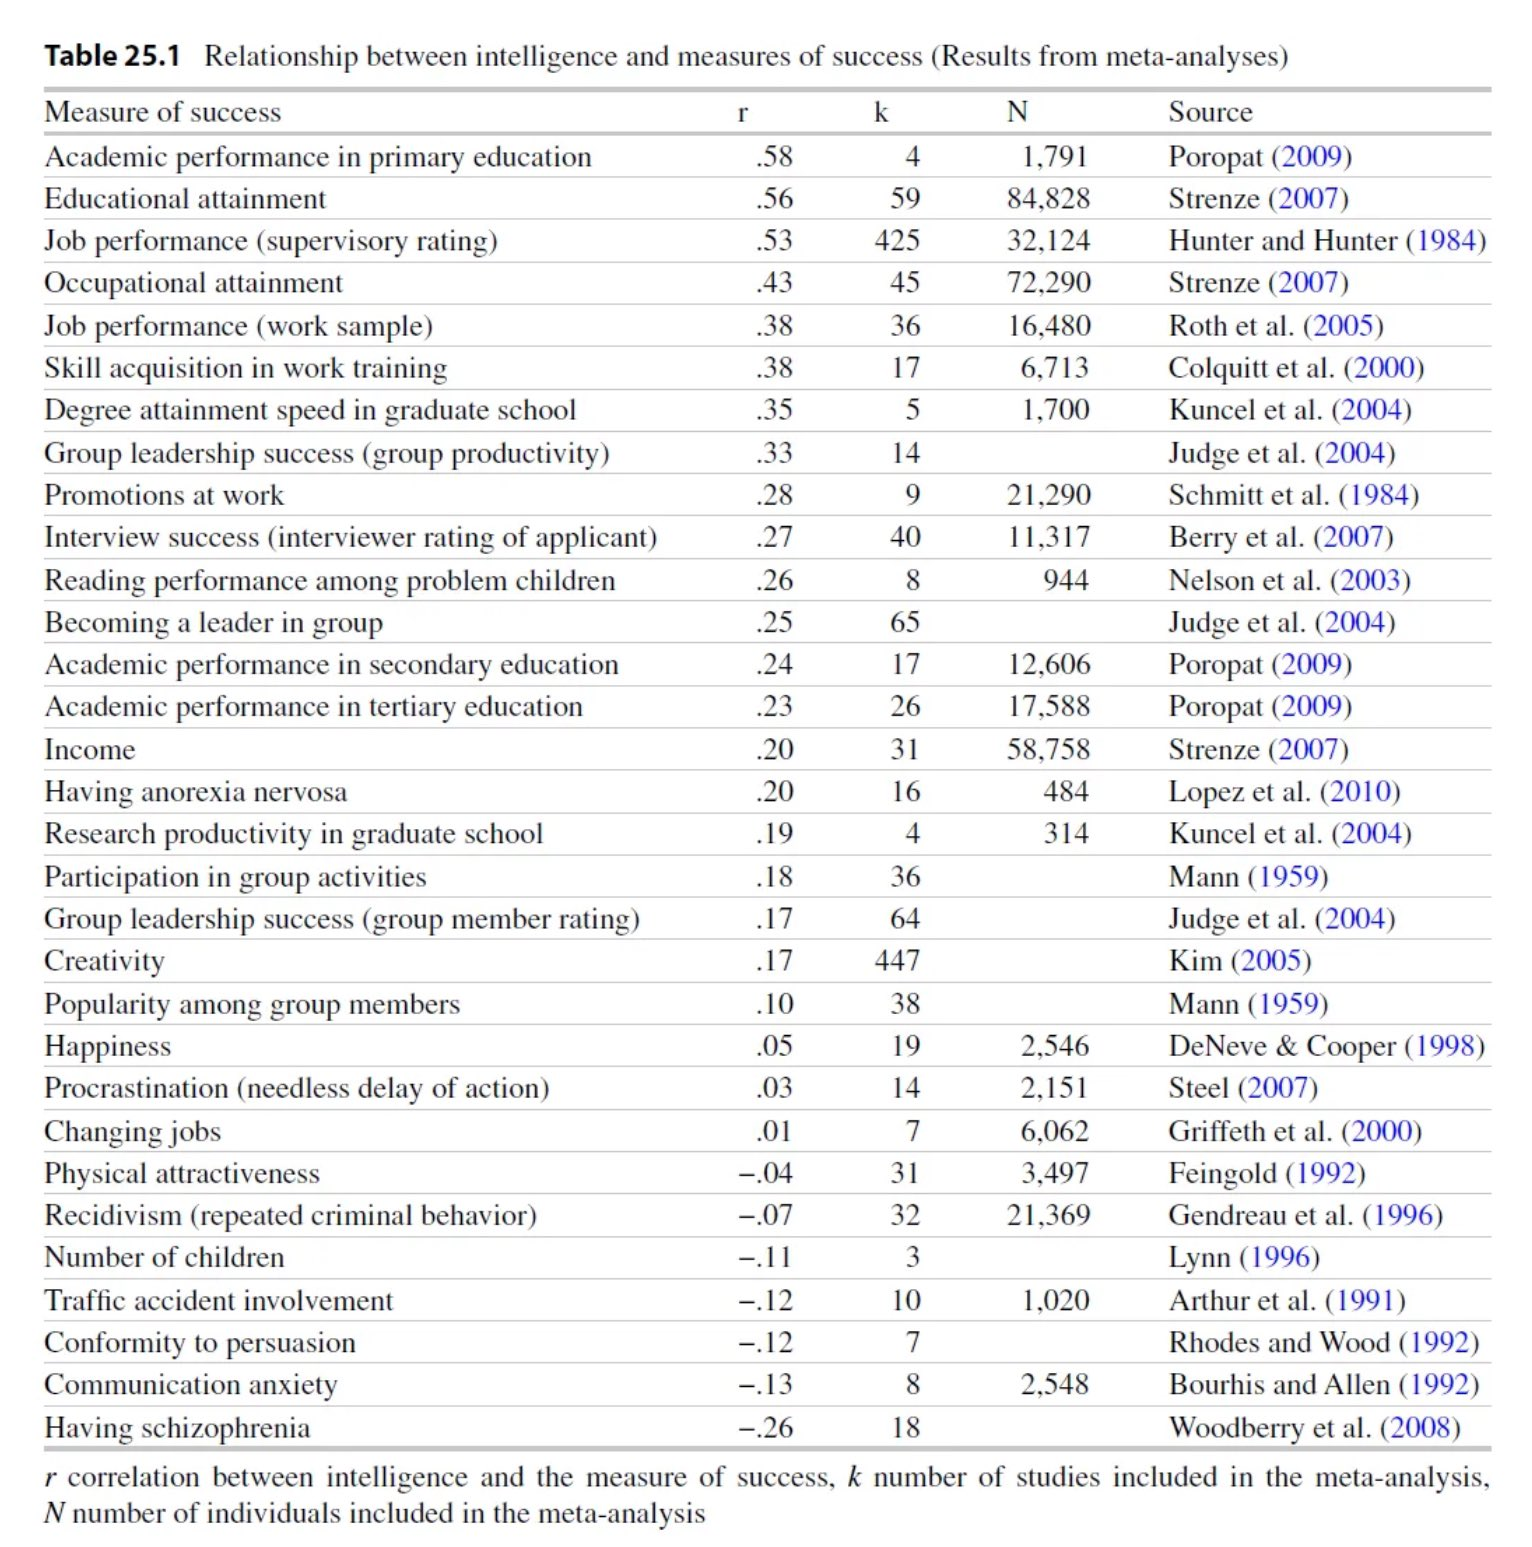
A century of evidence shows that IQ tests do far more than predict success on other IQ tests. Meta-analyses covering tens of thousands of participants converge on the fact that the general intelligence factor, g, is one of the single best predictors of upper and lower level education, occupational status, job performance, and much more (and is strongly causal). See our Everyday Life Outcomes article for more. Additionally, IQ is also correlated with many biological variables1 such as brain size, brain glucose metabolic rate, the latency and amplitude of cortical-evoked potentials, and brain nerve conduction velocity, as we briefly list here.
"All online IQ tests are fake and only an in-person administration is accurate."
- Most popular online IQ tests are unreliable because they ignore psychometric standards, not because they are taken online.
- Well-constructed online administrations of professional tests (e.g., WAIS-IV, WISC-V) have been proven to be nearly identical to in-person testing.
- Studies show remote and in-person IQ testing differ by far less than one-tenth of a standard deviation, below significant thresholds.
- Validity depends on test design, norms, and administration quality; the difference between mode of administration (online vs. in-person) itself is minimal.
No, the frequent claim one finds in the average comment section that "all online IQ tests are fake" and "only a psychologist-proctored IQ test is real" is an oversimplification and misattributes the reason to the mode of administration (online vs. psychologist-proctored). While most online tests that dominate search results and social media feeds are unvalidated and nothing more than a quick cash grab, not all of them are. These commercially driven tests are usually made without any knowledge of psychometrics or its standards, often throwing together random questions and returning random scores at the end, and this has severely damaged public confidence and understanding in psychometrics. This is why these tests don't publish data on reliability, validity, or normative sampling. However, this doesn't mean all online IQ tests are inaccurate, and you can find many validated online tests in this community's resources list.
However, one misconception that has arisen is that the online format is inherently less accurate than an in-person format. Validity depends on the construction of the test and the conditions of administration, and recent research proves this. A 2024 randomized repeated measures study showed that adults who completed the Wechsler Adult Intelligence Scale–IV (WAIS-IV) through an online administration earned practically the same scores as an in-person administration. The mean differences on 13 of 15 subtests were smaller than the test's own standard error, and FSIQ correlations exceeded .9010. Furthermore, a meta-analysis published in 2025 pooled dozens of remote neuropsychology studies and found that, across verbal and non-verbal tasks, remote and in-person administrations differed by well under one tenth of a standard deviation, below thresholds that matter in clinical and educational decisions11. This has also been found for children on the WISC-V12 as well as clinical populations being administered online. Even self-administered online tests have met the bar, for example, the ICAR-16 shows a convergent validity of r ≈ .80 with the in-person WAIS-IV, and the longer ICAR-60 reaches the high .80s to low .90s13.
So the final answer is pretty simple: bad online IQ tests are bad because they ignore psychometric standards, not because they happen to be online. Well-designed digital tests replicate in-person accuracy, with the mode of delivery contributing little more than trivial measurement error. Before trusting any IQ score, whether it is in-person or online, try to find evidence that the test is reliable, properly normed, and validated for the purpose you have in mind. If that evidence is there, the mode of administration makes no difference; if it is absent, the test was never trustworthy to begin with.
"There is more than one intelligence, but IQ tests only measure one narrow definition of it."
- Tests designed to measure different "intelligences" consistently load on a single general factor (*g*) across batteries and cultures.
- Strengths and weaknesses exist, but they are all clustered around general intelligence rather than independent, separate abilities.
- Full Scale IQ already covers a comprehensive definition of intelligence, spanning verbal, spatial, numerical, memory, and speed abilities to extract what they share in common.
- Measures based on multiple-intelligences theory add little predictive value once g is accounted for.
Howard Gardner's Multiple-Intelligences (MI) framework is a common concept taught in education, yet whenever researchers administer tasks meant to isolate his eight (now nine) "independent" intelligences alongside standard reasoning, memory, spatial, and speed items, factor analysis keeps extracting a single general factor (g) of intelligence that all tasks load on (replicated across dozens of batteries and cultures).
Strengths and weaknesses certainly exist, but they cluster around that shared intelligence rather than in independent, separate cognitive abilities. Moreover, g (represented by an FSIQ score) predicts classroom learning, job performance, income, health, and even longevity better than any MI-based measure, while MI scores add little when g and personality are controlled14. When a sample of 436 adults was administered three non-overlapping test batteries (the WAIS, the Comprehensive Ability Battery, and the Hawaii Battery with Raven), it was found that the g factors extracted from each were practically identical (r = .99–1.00)15.
The same general factor re-emerges no matter how you sample cognitive tasks or compute the statistics. Contrary to the misconception that an FSIQ score is "one-dimensional," modern IQ batteries already test language, spatial, numerical, working-memory, and processing-speed tasks. Their accuracy comes precisely from aggregating what is common across many kinds of items, and this is why it is the most validated construct in differential psychology.
Importantly, even Gardner has acknowledged that it doesn't matter if Multiple Intelligences doesn't fulfill a scientifically validated model of cognitive structure. In reflecting on the empirical criticisms of MI, Gardner stated:
…and even if it turns out that the bad guys are more scientifically accurate than I am, well, life is short, and we have to choose how we spend our time, and that's where I think multiple intelligence thinking will continue to be useful, even if the scientific evidence doesn't support it.
Howard Gardner, Creator of Multiple Intelligences Theory
While referring to researchers of psychometric g as "the bad guys", Gardner concedes that even if MI lacks empirical support as a theory of intelligence, it is still philosophically useful. That position places MI outside the domain of scientific models meant to explain individual differences in cognitive ability. IQ tests, by contrast, are explicitly designed to model those differences and are evaluated by their statistical coherence, replicability, and predictive validity. The unfortunate disproportionate amount of attention MI has received within educational and academic settings contrasts with the lack of scientific evidence supporting it as a theory of intelligence. MI seems appealing less for its empirical basis and more for its reassuring claim that everyone is intelligent (just in different ways).
"IQ doesn't measure anything meaningful beyond 120 IQ and is only good for telling apart intellectual disability."
- Studies show similar intelligence–achievement relationships above and below the 120 IQ range.
- Long-term longitudinal studies of highly gifted samples show widening differences in rare, high-level accomplishments.
- Perceived ceilings are largely artifacts of range restriction, sampling limits, and misinterpretations of SLODR.
- There is no empirical threshold beyond which intelligence stops being predictive.
A common claim is that above some arbitrary threshold, usually 120 IQ, extra IQ points have so little practical effect that scores become meaningless to compare. However, the research directly contradicts this. Meta-analytic work pooling 70 independent datasets showed that the correlation between psychometric intelligence and creative achievement shows no statistically significant difference above the 120 threshold vs. below it16. Breakpoint studies that tried to locate a ceiling also find either no ceiling at all or only for low-level "creative potential", while genuine accomplishments keep rising with g. This means there is no threshold where transforming ideas into recognized work doesn't continue to benefit from more mental ability across the entire IQ range17.
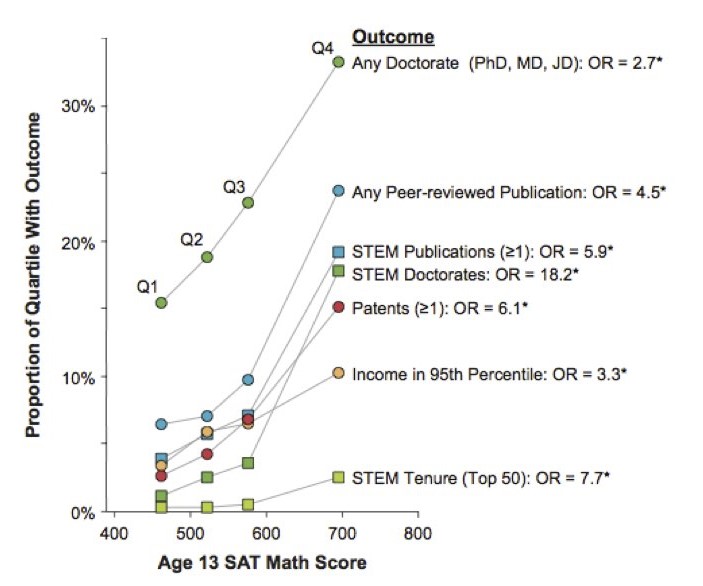
The Study of Mathematically Precocious Youth (SMPY) has tracked thousands of adolescents who scored in the top 1% (135 IQ; 390 or higher SAT-M at age 13) since the 1970s18. The top quartile of this already-elite group went on, by their early 30s, to earn patents at roughly six times the rate of their peers in the bottom quartile, secure tenure-track jobs at top 50 research universities eight times as often, and have incomes in the top 5% of incomes nationwide three times as often (and more, as the attached graph19 shows). These widening gaps, captured 25 years after the initial testing, show there is no loss in predictive power beyond some threshold of IQ, and that IQ can predict rarer and more prestigious accomplishments later on.
Fun Fact. Julian Stanley, director of the SMPY, stated that Terence Tao had the greatest mathematical reasoning ability he had found in years of intensive searching (scored 760-M at age 8). Today, Tao is widely regarded as one of the greatest living mathematicians.
Among the 1,528 mostly-Californian children whose childhood Stanford-Binet IQ averaged around 150 (all above 135) in Lewis Terman's longitudinal study, the upper half of the IQ distribution went on to earn more Ph.D.'s, author more books and scientific papers, and receive higher expert "eminence" ratings than the lower half, even though every participant was well above the "120 IQ" threshold20.
There are a few theorized reasons why this myth persists, the first being range restriction. When universities and programs select people only on the upper end of the scale, range restriction artificially shrinks the remaining variance (due to only analyzing a "restricted range" of people). This makes differences seem smaller than they really are. Another less common one is a misunderstanding of Spearman's Law of Diminishing Returns (SLODR). While SLODR states that the g-loading of a test decreases the higher ability you go, this doesn't mean higher ability scores are meaningless, nor does it mean this is a universal effect that extends equally across every test. Furthermore, when trying to track success at the top level (through patenting, grants, Nobel-level discoveries, etc.), you need very large samples and decades of follow-up before you can measure any predictive power, which is often very hard to do. However, when these hurdles are cleared, the evidence consistently shows that IQ differences in the high range are still meaningful.
"Hard work, creativity, or emotional intelligence matter more than IQ."
- g is the strongest single predictor of academic performance, job performance, and learning speed across large-scale meta-analyses.
- Non-cognitive traits such as conscientiousness, grit, creativity, and emotional intelligence show significantly smaller correlations with real-world outcomes once IQ is controlled.
- Creativity and divergent thinking contribute modestly to achievement, but their predictive power is weaker and more domain-specific than g.
- Personality traits add only marginal incremental validity on top of IQ, indicating that effort and motivation are multiplicative rather than substitutive factors.
- Hard work, creativity, and emotional intelligence matter, but are far weaker compared to IQ’s breadth or predictive strength across education, work, and life outcomes.
It is understandable to believe that other factors are more important than IQ, such as hard work, creativity, or emotional intelligence, as that is what Western culture has instilled; however, the evidence from large-scale meta-analyses shows the opposite. General intelligence "g", measured by IQ, is the most powerful predictor we have for learning speed, job competence, earnings, and even many forms of creativity, ahead of other measurable personality traits. A 240-sample psychometric meta-analysis covering 105,185 students found a population correlation of p ≈ .54 between IQ and school grades, dwarfing every non-cognitive trait examined in the same literature21. On the other hand, conscientiousness shows a weighted correlation of only r ≈ .22 with GPA in Poropat's 70,000-participant review22. g explains over four times as much variance in academic performance as diligence and hard work do.
Schmidt and Hunter's meta-analysis of 85 years of personnel selection research reports a corrected validity coefficient of p = .51 for General Mental Ability (GMA) in predicting overall job performance for medium complexity roles (which account for roughly 62% of U.S. jobs)23. No other single predictor approaches this level of accuracy. Adding personality measures (such as conscientiousness24) only increases validity by mere hundredths, showing that while diligence helps, the most important trait is g.
In 2022, Zisman & Ganzach re-analyzed six large longitudinal surveys (NLSY79/97, WLS, MIDUS, ADD-Health, and the German PIAAC). Across them, intelligence explained 23% of the variance in educational attainment versus 5% for the entire Big-Five personality profile; for GPA, the gap was 23% vs. 2%, and even for wages, IQ still doubled personality (8% vs. 4%). The authors conclude that the "personality beats IQ" narrative is "greatly exaggerated"25.
Creativity is not an exception either. Large meta-analyses show that general intelligence contributes more to tangible success. IQ correlates about .54 with school grades; in contrast, divergent-thinking (DT) tests top out at ~.22 with academic achievement26. Furthermore, divergent-thinking tests correlated r = 0.216 with creative achievement, while IQ tests correlated r = 0.167 with creative achievement27. While DT does a little better than IQ, both effects are small (less than 5% shared variance). Generating ideas helps, but psychometric g remains the stronger, more versatile asset.
In the literature, emotional intelligence (EQ) has not been demonstrated to be a real and meaningful construct or ability, as the excerpts below show3. This is compounded when looking at various studies attempting to gauge the predictive validity of EQ, which are often poorly designed, not formally published, and not peer-reviewed. Studies that make it past these barriers don't paint a good picture for EQ.
The published literature is much less favorable to emotional intelligence and shows that the tests of emotional intelligence are weaker predictors of academic performance than IQ (Siu & Reiter, 2009). For example, high school rank (a measure of academic success) correlates r = .23, and job performance correlates r = .28 with emotional intelligence (Mayer et al., 2008, p. 337).
...The correlations between emotional intelligence and life outcomes may just be due to the [Big Five] personality traits – such as agreeableness, conscientiousness, and neuroticism – that tests of emotional intelligence measure (Matthews et al., 2004; van der Linden et al., 2017). This possibility is strengthened by studies which show reduced correlations – sometimes as low as zero – between emotional intelligence and practical outcomes after controlling for personality traits (N. Brody, 2004).
...Controlling for intelligence also reduces the correlation between emotional intelligence and academic outcomes, sometimes to zero (Mayer et al., 2004, p. 206). This indicates that there is little – if anything – new in emotional intelligence.
Russell Warne, In The Know: Debunking 35 Myths about Human Intelligence, p. 2313.
Why does IQ consistently correlate more with success? Higher g reduces the time and effort it takes to master new skills, leaving more for strategy, self-regulation, and even creative output. Hard work, social skills, and disciplined habits absolutely matter, but they are multiplicative, not substitutive, factors. When two people exert equal effort, the one with greater cognitive efficiency learns more per hour, performs better per source of feedback, and compounds those gains over time. To be clear, effort, creativity, and emotional intelligence are not irrelevant or useless; however, it does not substitute for general intelligence. IQ is not everything, but across education, work, income, and innovation, it remains the most robust predictor we have, above hard work, creativity, and emotional intelligence.
"I know successful low IQ people and unsuccessful high IQ people, so IQ must be fake."
- Single counterexamples don’t refute a correlation: IQ predicts outcomes probabilistically, not deterministically.
- Knowing exceptions is expected under any real-world correlation. It doesn’t make IQ "fake," it shows intelligence is one factor among many.
Using a couple of anecdotal counterexamples to try to disprove IQ reveals a basic misunderstanding of how probability works. Everything in life, from blood pressure readings to market forecasts, is a probabilistic signal, not a deterministic one, and IQ is no different.
Let's take a look at one specific example:
Decades of data place the correlation of IQ and primary school grades at around ~0.607. Under the usual normal assumption, we can use Greiner's equality28 to estimate the probability that two randomly chosen pairs are concordant with the claim that higher IQ -> better primary school grades.
$$ \tau = \frac{2}{\pi}\arcsin(r) $$
$$ \tau = \frac{2}{\pi}\arcsin(0.60) \approx 0.41 $$
Using τ, we can then calculate the probability of concordance with:
$$ P_{\text{concordant}} = \frac{\tau + 1}{2} $$
$$ P_{\text{concordant}} = \frac{0.41 + 1}{2} \approx 0.705 $$
This means that the higher IQ primary school student will have better grades than the lower IQ one roughly 70% of the time. Pointing to the other 30% of cases and trying to draw a reverse conclusion is just inaccurate. Expecting any correlation to deliver deterministic predictions is not skepticism; it is innumeracy. A related myth is that IQ scores are not useful for selection, which we address later in the article here.
"The SAT measures academic achievement and can be practiced for, therefore SAT scores are not a good measure of intelligence."
- Psychometric studies show the pre-1994 SAT correlates very strongly with independent IQ measures (≈.70-.80), similar to correlations between professional IQ tests.
- Practice and coaching effects on the old SAT were tiny, with hundreds of hours typically amounting to only a few score points on average and far too small to explain its high correlations with IQ. Moreover, controlling for SES barely reduces its external validity.
- Later revisions intentionally shifted the SAT toward curriculum-based achievement, reducing (but not eliminating) its g loading and making it much more trainable.
- The SAT before 1994 was designed as an aptitude test and was highly *g*-loaded, with strong predictive validity and convergent validity with other IQ tests.
While there is some truth to this statement, some distinctions and clarifications have to be made. This statement is only true for the SAT after 1994, when the College Board deliberately redesigned the test to mirror high school coursework. "Thanks to an unprecedented assault from the head of the University of California system, the College Board (the nonprofit organization that owns the SAT) has begun its biggest overhaul ever of the test"29. In early 1994, the verbal section dropped antonyms, doubled the share of passage-based reading, and the math section began allowing calculators and open-ended responses. These changes were repeated in subsequent updates to the test, diluting its saturation with the general intelligence factor (g). Due to these changes, the modern SAT moved from an aptitude test to a scholastic achievement test, which can definitely be practiced for. However, this wiki will be specifically referring to the SAT forms before 1994, which have been found to be psychometrically equivalent to a Full Scale IQ test.
Directly admitted by the College Board president, Gaston Caperton, "in its original form [the SAT] was an IQ test."29 In 2004, Frey & Detterman, using a National Longitudinal Survey of Youth subsample who had taken the old SAT, found the composite score correlated r = 0.82 with g extracted from the ten subtest ASVAB, and r = 0.72 (range-restricted) with Raven's Advanced Progressive Matrices, a well-known fluid reasoning test30.
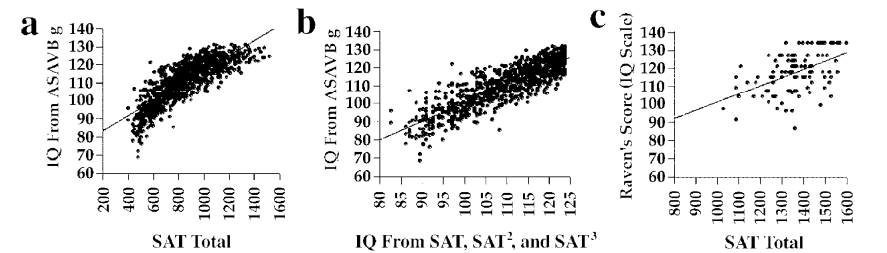
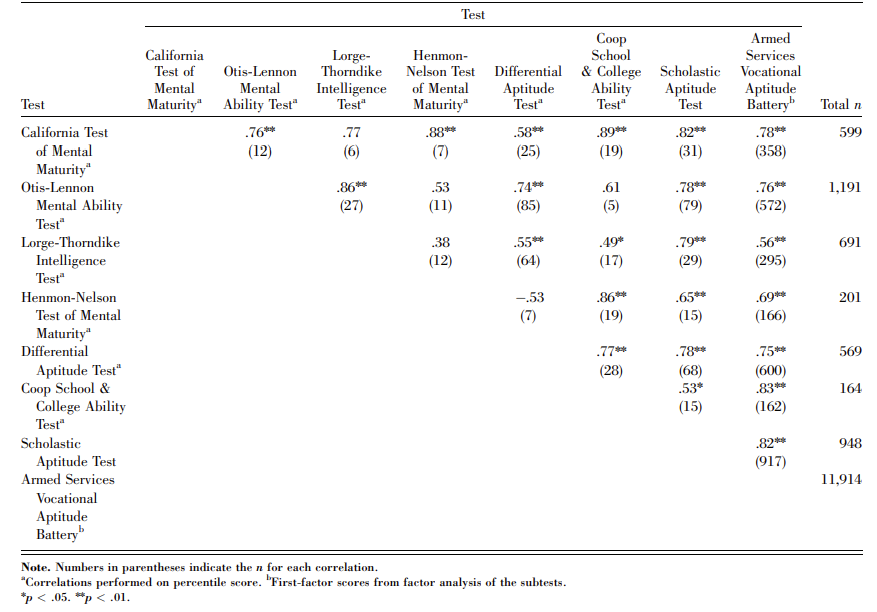
Furthermore, as pointed out by Frey & Detterman, "it is evident from these results that there is a striking relation between SAT scores and measures of general cognitive ability. In fact, when one examines the results in [Figure 5], especially those in the ASVAB column, it appears that the SAT is a better indicator of g, as defined by the first factor of the ASVAB, than are some of the more traditional intelligence tests."30
Another independent study of the SAT's value as an IQ test confirms the above findings. "In a study of 339 undergraduates, Brodnick and Ree (1995) used covariance structure modeling to examine the relationship between psychometric g, socioeconomic variables, and achievement-test scores. They found substantial general-factor loadings on both the math (.698) and the verbal (.804) SAT subtests."30 While they used the SAT itself to define their first factor as g, the evidence strongly suggests it measures the same first factor g measured by IQ tests. Another thing that should be kept in mind is that these loadings are deflated due to Spearman's Law of Diminishing Returns (SLODR), as the sample of students who took SATs was above average, college-bound high school graduates, placing them above the average 100 IQ population.
Why was the old SAT so g-loaded? Its creator, Princeton psychologist Carl Brigham, lifted item formats directly from the World War I Army Alpha intelligence tests he developed, meaning the exam's backbone was abstract analogies, antonyms, and logic puzzles that were always intended as an IQ test (and also the exact formats which the post-1994 revisions have removed).
The common objection of the SAT being skewed by the amount of prep time invested by test takers is directly contradicted by large-scale College Board studies, which put coaching gains at ~9-15 points on verbal and ~15-18 points on math31. Furthermore, there are heavy diminishing returns to the amount of time spent, as demonstrated in Figure 6 below.
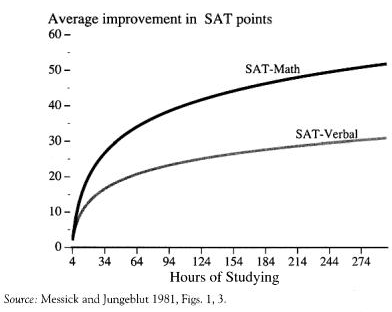
The gains shown above equate to approximately between one to six IQ points- far too small to explain uncorrected correlations in the .70-.80 range with independent IQ measures. One theory as to the resistance of the SAT to the practice effect compared to other tests is its unique property of having multiple forms. Contrast that with most professionally administered IQ tests (such as the WAIS-IV or SB-V), which rely on a single copyrighted form that proctors have to guard. If a client or an internet leak reveals those items, the whole instrument is compromised until the publisher can fund and norm an alternate edition (a process which takes years). By design, the SAT's rotating forms limit any item-specific exposure that inflates retest scores on pro tests.
Moreover, some critics of educational admissions tests, like the SAT, assert that the tests measure nothing more than socioeconomic status (SES) and that their apparent validity in predicting academic performance is an artifact of SES. However, meta-analyses on the SAT show that statistically controlling for SES reduces the estimated test-grade correlation from r = .47 to r = .44. Thus demonstrating that the vast majority of the test academic performance relationship was independent of SES32.
Few IQ tests have ever combined the accuracy of a top-tier FSIQ battery with the scale, form security, and predictive power of the pre-1994 SAT. With multiple peer-reviewed independent studies reporting g correlations on par with how gold standard, professional tests correlate with each other, the old SAT can definitely stand with more conventional IQ tests. However, where the SAT is unique is that, unlike pro tests given to a few thousand volunteers, the SAT was normed on millions of examinees every year and continuously equated every year. A vast, rotating item bank also meant each administration kept coaching effects trivial. Given the SAT's predictive validity with college and even mid-career outcomes in samples exceeding 200,000 students, the old SAT may be the most underappreciated intelligence test ever created.
"IQ tests are undermined by the fact that experts can't agree on the definition of intelligence."
We address this in a section of our g factor article.
"How can you say this [e.g., matrix reasoning, vocabulary] test captures intelligence?", or Yardstick mirrors construct.
This misconception arises from portraying the superficial appearance of an intelligence test as if these visible features mimic the essence of the phenomenon it measures. However, this is not the case. Just as a thermometer’s appearance does not define the nature of heat, the specific content of a test item is merely a vehicle to tap into latent cognitive processes. Read our g-Loadings and Test Characteristics section (and the rest of that article).
Bias
"IQ is mostly environment, not genetics."
- Intelligence shows moderate heritability in early childhood but becomes increasingly genetic with age, exceeding ~80% heritability in adulthood.
- Shared family environment explains some differences in childhood IQ but its influence fades over development, while genetic effects grow stronger (the Wilson effect).
- Environmental factors mainly determine whether individuals reach or fall short of their genetic potential, rather than eliminating stable differences between people. Genetic influence explains the vast majority of variance in IQ between adults (~80%).
The belief that intelligence is primarily shaped by environment stems from a broader, cultural narrative of tabula rasa, the idea that individuals are all born a blank slate and are differentiated as they grow up through parenting, schooling, environment, and social conditions. While this is an appealing idea, it doesn't align well with what has been empirically discovered. A lot of the confusion comes from conflating environmental influence on the cognitive level with what explains differences between people.
First, though, three terms must be distinguished:
- Genetic influence: variance in IQ which can be attributed to inherited differences in DNA between individuals.
- Shared environment: environmental influences that are shared between siblings raised in a household but differ from other families (e.g., socioeconomic conditions, parental education, neighborhood).
- Nonshared environment: environmental influences that are unique to each child within the same family and contribute to differences between siblings (e.g., illness, accidents, friend/peer experiences, idiosyncratic developmental events, and measurement error).
We have yet to identify much of the nonshared environmental variance in IQ, but evidence suggests it is a cumulative effect of many small, individual developmental influences, including biological (i.e., prenatal environment, minor birth injuries, illness, neurotoxins), social (i.e., different peer/friend groups, different teachers, idiosyncratic life events), and stochastic factors (i.e., random variations in neurological development, measurement error) rather than some kind of systematic difference within the family environment1.
Also, to make it clear, heritability is not a measure of immutability or genetic determinism. Rather, it quantifies how much of the variance in intelligence, within a given population and range of environments, is statistically associated with genetic differences. In other words, it defines how much variance between individuals' intelligence in a certain population can be attributed to the three different influences we have defined above.
What decades of longitudinal research show is that differences in intelligence become increasingly genetic with age (known as the Wilson effect), rather than shared environmental ones. By the time an individual crosses puberty and reaches adulthood, over 80% of variance in intelligence can be attributed to genetic influence33.
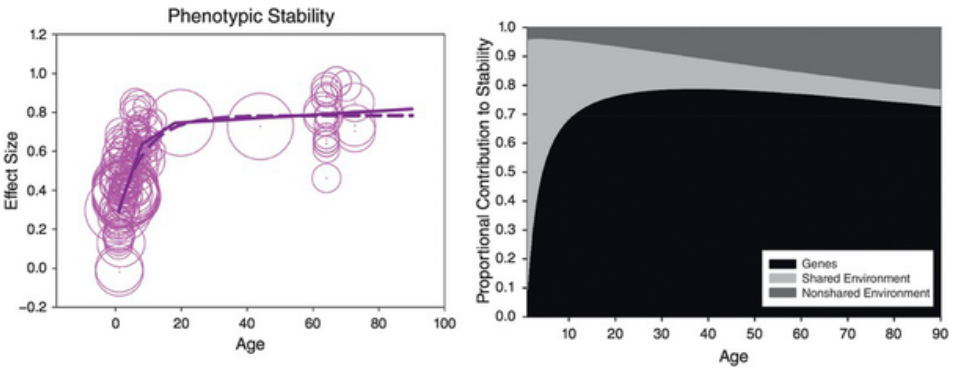
The left panel shows that while IQ is moderately unstable in early childhood, rank-order differences consolidate rapidly. The right panel explains why: genetic differences increasingly account for the persistence of individual differences, whereas shared environmental effects fade with age34. We outline the stability of intelligence and IQ scores across the lifespan here in the wiki.
A useful analogy here is physical height, which follows a closely parallel developmental pattern; just as some were the tallest in their class as kids but stopped growing and are average height in adulthood, those who were "gifted" as kids may struggle to meet those same expectations as adults. However, the inverse may also be true, analogous to growth spurts. Nonetheless, the tallest kids usually end up being tall as adults. Height also has a strong increase in heritability, similar to the Wilson effect in intelligence. Shared environmental factors such as nutrition and illness matter more early on, but genetic differences increasingly explain who ends up taller than who as kids approach puberty and adulthood, with adult height typically exceeding 70% heritability35.
Twin and adoption studies converge to the same conclusions, with adopted children modestly resembling their adoptive parents in childhood, but in adulthood, similarity to biological parents increases, even when, in many cases, they've never even met their biological parents. The Minnesota Transracial Adoption Study found black children adopted into white, middle-class families showed elevated IQs in childhood, consistent with increased shared environmental influence in childhood, but their scores later declined toward familial means in adolescence and adulthood36 (see the last two listed misconceptions in the Extra/Rapid-Fire section).
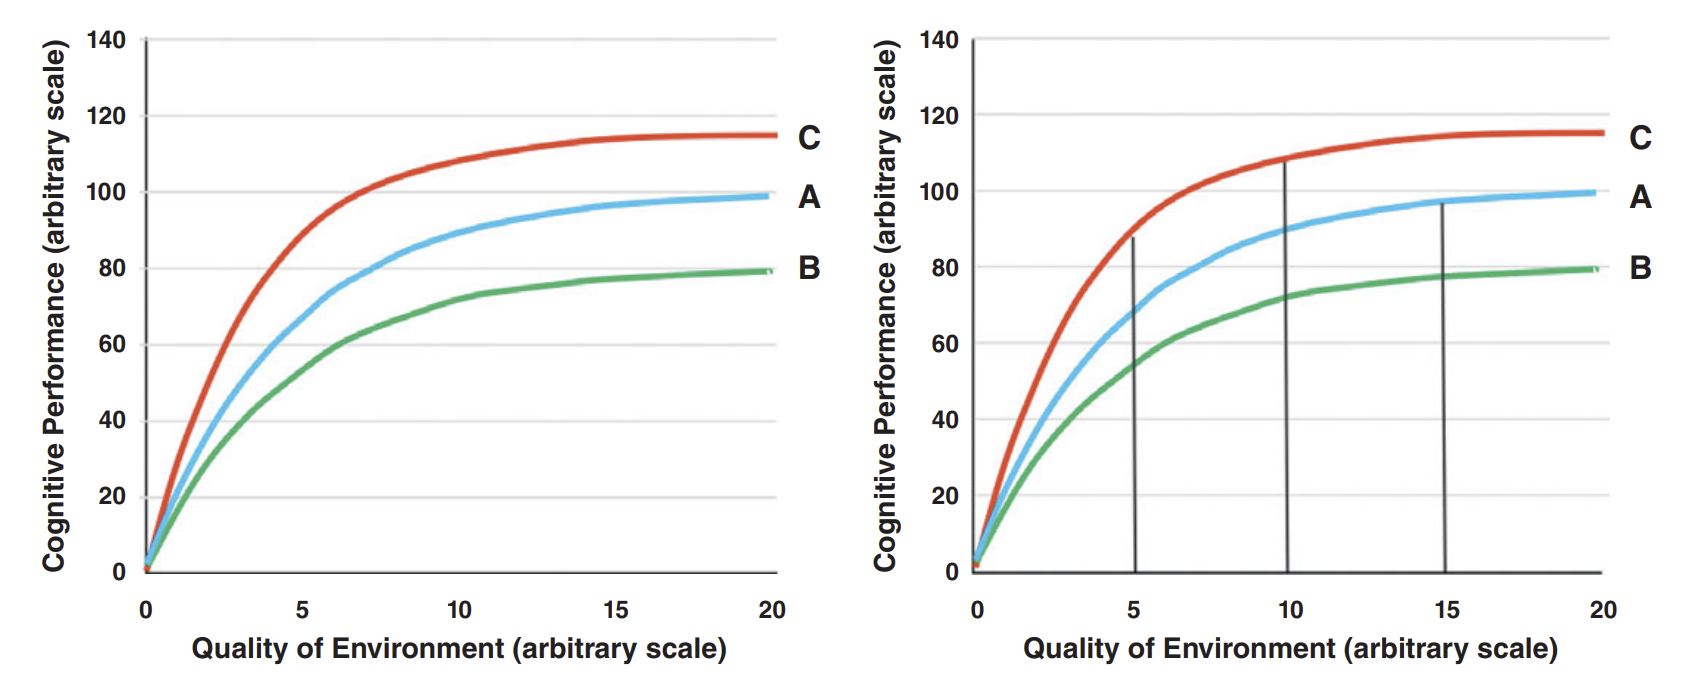
Figure 837 helps visualize how genes and environment work together to shape intelligence. The reaction range idea shows that genes don't fix a single IQ score, but set a range of possible outcomes, with the environment determining where someone ends up within that range. Poor environments can suppress cognitive development for almost everyone, while moving from very bad to decent conditions can produce large gains. However, there are diminishing returns to gains, and differences between people will increasingly reflect genetics as individuals approach their ceilings. This explains why environmental interventions can raise average IQs without eliminating stable differences between individuals.
There is no escape from the conclusion that nature prevails enormously over nurture when the differences of nurture do not exceed what is commonly to be found among persons of the same rank of society and in the same country.
Sir Francis Galton, quoted in Vigue (2023)38.
In short, IQ is not "mostly environment". Early environments matter, but mainly in whether they hold people back or allow them to reach their potential. Poor environments can suppress cognitive development and keep people from realizing the abilities their genetics would otherwise allow, while good environments help people reach that ceiling. As development continues and basic environmental needs are met, genetic differences increasingly shape the stability of intelligence.
"IQ tests are culturally biased, so scores are meaningless."
- In psychometrics, a test is biased only if it measures different constructs or predicts outcomes differently across groups, not if group averages differ.
- Modern IQ tests show items are equally difficult for different groups at the same ability level.
- IQ scores predict academic and occupational outcomes with similar accuracy across racial and ethnic groups within the same population.
- When used as intended and properly normed, IQ tests measure the same underlying ability across groups and are not culturally biased within general national populations.
The claim that IQ tests are “culturally biased” is a common criticism of intelligence testing, but it rests on a misunderstanding of what bias actually means in psychometrics. A test is biased only if it measures different things, or predicts outcomes differently, for different groups. Average scores simply differing between groups does not mean bias exists. By this definition, modern IQ tests show little to no cultural bias within the populations they are designed to assess.
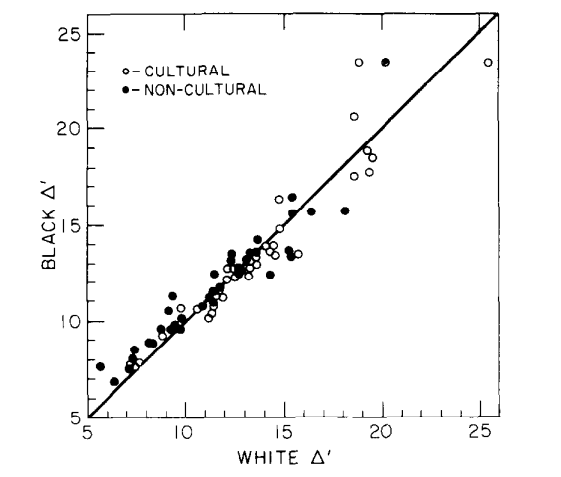
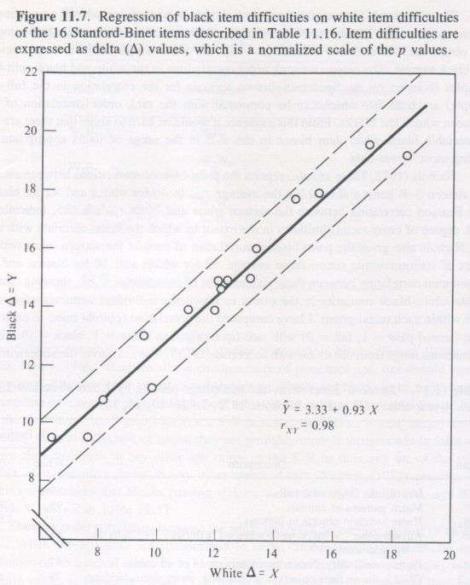
Psychometric bias can be evaluated using tools such as differential item functioning (DIF) and measurement invariance. In short, DIF asks whether test items are systematically easier or harder for one group or another after controlling for overall ability. Decades of research show that well-constructed IQ tests exhibit minimal DIF across racial and ethnic groups within the same country39. Items that are difficult for one group are also difficult for others at the same ability level, indicating that the tests are measuring the same underlying construct (g) rather than some culture-specific knowledge.
This pattern has been repeatedly demonstrated in the United States. If IQ tests were culturally biased against certain racial groups, we would expect them to overpredict or underpredict real-world outcomes (such as grades or job performance) for those groups. Yet, we observe the opposite. IQ scores predict academic achievement, occupational performance, and training success with similar regression slopes and comparable accuracy across racial groups.40 This invariance of predictive validity is one of the strongest pieces of evidence against the claim that IQ tests are culturally biased within native-speaking populations.
Another misconception fueling the idea that bias exists is the idea that modern IQ tests are designed to be universal, culture-free instruments, which is completely untrue. IQ tests are explicitly normed for specific national populations, so the U.S.-normed WAIS is intended for fluent English speakers in the United States, a French or German IQ test is normed separately for those populations, and so on. Using an IQ test outside its intended population does not reveal bias in the test; it just means the test is being used incorrectly. A low score obtained by someone taking a test in a non-native language is invalid by definition, the same way using child norms for an adult score or using the wrong measurement units would be invalid. However, these distinctions are often overlooked in public discussions, with cross-national differences or poor performance by individuals tested in the wrong language/settings often being used as evidence of bias. In reality, these are just misapplications of administration, not a flaw in the test itself or the construct it aims to measure.
In short, IQ tests are not “culture-free,” but they are not culturally biased in the psychometric sense when used as intended. Within native-speaking populations, they measure the same underlying cognitive ability, show minimal item bias, and predict real-world outcomes with comparable accuracy across groups. When an invalid administration occurs, the correct conclusion is not that IQ is biased, but that the test has been misapplied and the resulting score should not be interpreted.
"The Flynn effect...undermines IQ...[or] shows that we are significantly smarter than our ancestors."
The major reason for the secular gains in raw scores observed throughout the 20th century is a boring psychometric reality: it is due to new age cohorts' increased familiarity with common test structures. Since it was test-specific, practically no gains were observed for some highly g-loaded tests, such as the old SAT and AGCT, as well as tests of certain facets of working memory.
- On tests susceptible to the FE, factor analyses show that the IQ scores do not measure the same abilities in the same proportions in different cohorts, so they are not directly comparable across cohorts and/or long stretches of time; they also show that the gains are not on g.
- Thus, IQ tests must be remade and renormed over time, which does not undermine IQ, because experts have never espoused that the tests themselves are universally accurate across time and cultures. Tests are routinely adapted for different cultures. We address all of this in our Flynn Effect article.
- Improved health (nutrition, healthcare, less lead) was a relatively minor cause that had the most impact before the 1970s in the US.
- The Flynn effect does not undermine the heritability of IQ, because high heritability within a group (e.g., a specific generation) does not preclude large environmental effects between groups (e.g., across generations).
"Social/Educational interventions can drastically raise IQ."
While schooling has a causal effect on IQ scores (estimated at 1 to 5 IQ points), it has failed to change the underlying g factor, instead having domain-specific effects.
-
We cover this general topic in our education article. A related myth we address is that school quality and teachers are the main drivers of student achievement.
-
We show the stability of intelligence across the lifespan here. The fixity/stability of general intelligence is likely due to deeply-rooted evolutionary adaptations that serve to help safeguard an individual’s capacity to cope with survival challenges.
"Racial/Ethnic IQ differences...do not exist...[or] have significantly narrowed...[or] must be completely environmental in origin."
Per the evidence and the conclusions of the American Psychological Association (APA) task force report on intelligence published in 199641, Americans of European ancestry and Americans of Asian ancestry show similar average intelligence levels (~100 IQ), but Americans of Hispanic ancestry and Native Americans had lower averages, and the Americans of African ancestry group had the lowest average IQ score (85 IQ).
-
Of the differences, the APA report stated: "The cause of that differential is not known; it is apparently not due to any simple form of bias in the content or administration of the tests themselves." (Neisser et al., 1996, p. 97)41.
-
Despite the secular gains for all groups across generations (Flynn effect), the one-standard-deviation (15 IQ-point) gap between Americans of African ancestry and Americans of European ancestry (and other ancestries) has remained the same for at least sixty years42.
The average time separation between pairs of human populations since they diverged from common ancestral populations, which is up to around fifty thousand years for some pairs of non-African populations, and up to two hundred thousand years or more for some pairs of sub-Saharan African populations, is far from negligible on the time scale of human evolution. For example, (1) genetic selection on height and infant head circumference has occurred within the last few thousand years in particular populations43, and (2) frontier ancient DNA research has shown that, in the last 10,000 years, there has been rapid selection for intelligence and educational attainment in West Eurasia44. Thus, it seems a bad bet to argue that there cannot be average genetic differences in behavioral or cognitive traits like intelligence.
-
It is valid to fear misuse of scientific findings, but an outright dismissal of very plausible hypotheses on that basis is unreasonable.
-
To see what experts in intelligence research think of group differences and their origins, see our Expert Opinion and Group Differences section in the Flynn effect article.
-
A body of strong evidence suggests that genetics at least partially explains racial differences in IQ. Further Reading: “Thirty years of research on race differences in cognitive ability.”, and Chapters 28-30 of In the Know.
"Verbal subtests are biased since they measure what people have learnt, not innate intelligence."
- Verbal subtests are among the most highly g-loaded indicators on modern IQ batteries
- Verbal knowledge reflects differences in learning rate and cognitive efficiency, not mere rote memorization or cultural exposure.
- Longitudinal, twin, and genetic studies show that verbal ability becomes increasingly heritable with age, mirroring the developmental pattern of g.
- Verbal subtests are some of the most reliable and valid measures of general intelligence.
The point of an IQ test is to be a proxy for g, as g is a latent trait that cannot be directly observed. Modern batteries do this by sampling several broad abilities (fluid reasoning, crystallized knowledge, working memory, etc.) and then using their positive intercorrelations to extract a second-order g factor. Confirmatory-factor analyses of the WAIS-IV make this structure explicit: all four index scores (including Verbal Comprehension) load on a single g, with Vocabulary among the strongest indicators.45
There are centuries of empirical evidence that verbal items are not contaminants but some of the best g measures we have. In every large WAIS-IV sample, Vocabulary's g-loading equals or exceeds that of Matrix Reasoning. Even a two-subtest form made up of Vocabulary + Matrix Reasoning explains roughly 70-88% of the variance in Full-Scale IQ (to the point where the WASI uses it as a 15-minute proxy for the full battery).46
Why does vocabulary work so well? Because the causal arrow runs g → learning rate → knowledge store, not the other way around. People who are higher g will need less exposure in order to understand a word and all of its nuances, allowing them to naturally develop a larger vocabulary. Longitudinal studies show that higher early general ability predicts steeper later gains in both vocabulary and reasoning. A mutualism model even finds each skill accelerating the other during adolescence and early adulthood.47 Furthermore, twin and SNP studies find that heritability for expressive vocabulary starts around 25% in toddlers and rises above 50% by the teens, mirroring the exact same developmental trajectory of g, while recent GWAS meta-analyses have identified polygenic scores that forecast early vocabulary growth and later reading skill.48 49
Dropping crystallized knowledge subtests would significantly hurt the accuracy of Full Scale IQ tests as well. Meta-analyses spanning decades show that full-scale IQ (including its verbal components) predicts educational attainment, job performance, and income better than any nonverbal-only battery.50 By contrast, "culture-fair" tests such as Raven's matrices display lower g-loadings and weaker validity across diverse samples, which is why they have never replaced the Wechsler or Stanford Binet in clinical or selection settings.51 52 53
In fact, vocabulary item types are one of the most resistant to practice. A large meta-analysis of WAIS-IV retest data finds smaller practice gains for Vocabulary than for nonverbal subtests, meaning verbal scores are, if anything, more stable on retest54. Vocabulary is not just memorization and luck; it's another expression of the same general learning ability that drives fluid reasoning and working memory. See our Vocabulary section for a more comprehensive explanation.
Societal and Ethical
"IQ was used in the past to promote eugenics, so the whole system is biased."
- Historical abuse does not invalidate the construct or modern intelligence testing the same way it doesn't for any other scientific field.
- Modern IQ tests are ethically regulated, peer reviewed, and empirically validated, making the "IQ = eugenics" critique historically outdated.
Although early-20th-century eugenicists did misuse IQ scores, that history doesn't discredit modern IQ testing any more than bloodletting discredits today's medicine. Alfred Binet's original 1905 test was designed to help French schoolchildren who needed extra support and he specifically made sure not to label people as inferior. While we rightly remember past abuses, the field has been far past that for over many, many decades now, making the "IQ is eugenics" argument outdated.
Modern IQ batteries are built under the Standards for Educational and Psychological Testing, subjected to differential item functioning analyses to prune biased questions, audited by external reviewers, and validated against real-world outcomes that show similar predictive power across genders, ethnicities, and socioeconomic groups. Over the past century, psychometrics has undergone the same kind of rigorous overhaul that medicine, aviation, food science, or any other science-driven field you can name. Invoking past misuse doesn't invalidate modern intelligence testing any more than it would for any other field. Further Reading. The noncentral fallacy - the worst argument in the world? (General), Chapter 32 of In the Know (topical), and the "Eugenics" article from the Stanford Encyclopedia of Philosophy (General; distinguishes between coercive eugenics and liberal eugenics).
"Considering IQ is not useful for real-world decision-making (e.g., selecting applicants)."
The serious consequences of neglecting IQ for selection were made especially apparent in a US government initiative called Project 100,000. Between 1966 and 1971 (during the height of the Vietnam War), the US Department of Defense increased the number of men eligible for the draft by lowering the minimum IQ needed for military service from 92 to 71 (Gregory, 2015, pp. 100–102)55. Secretary of Defense Robert McNamara believed that extra training would make these men suitable soldiers and, after their service, productive members of society. Over the course of Project 100,000’s existence, 354,000 men were inducted under relaxed psychological and medical standards; 91% of these men were inducted due to the lowered minimum IQ (Rand Corporation, n.d., p. 5).
Project 100,000 was a spectacular failure. Men in Project 100,000 were harder to train and were less competent soldiers, which placed lives at risk. Over half of the men were dishonorably discharged (p. 196)55. They experienced psychiatric problems at a rate that was 10 times higher than that of other soldiers56, and their death rate was three times higher than average (p. xiv)55. While some men from Project 100,000 were good soldiers, the extra training and supervision in the military did little for most soldiers to compensate for their low IQ.
The cause of Project 100,000’s failure was not the American military’s lack of motivation or resources to bring low-IQ men up to standard levels of performance. Instead, the failure originated in McNamara’s and other decision makers’ lack of understanding that IQ differences lead to fundamental differences in people’s ability to function in their environment. Contrary to McNamara’s and Collins’s (1979) beliefs, people are not interchangeable cogs that can be trained to fill nearly any job (Gottfredson, 1986). Read our Everyday Life Outcomes for more.
Miscellaneous
"Richard Feynman was a genius, but he only scored 125 IQ."
- The often cited 125 IQ score comes from an adolescent school test with limited documentation, unknown format, and likely ceiling effects.
- Psychologists would not consider a childhood verbal score representative of adult Full Scale IQ, especially for someone with extraordinary mathematical and scientific ability.
- Feynman’s reported score is not a valid IQ score that reflects his capabilities as an adult. Using it as a rhetorical argument against IQ's importance is misleading.
A common belief is that Feynman is 125 IQ. The test on which Feynman scored 125 was when he was an adolescent in high school, meaning his scores are most likely not representative of his capabilities as an adult. We also cannot determine whether or not the test was a verbal test or a full-scale test, though it is heavily speculated that it was a verbal test, meaning measurements of Feynman's strong fluid reasoning skills were neglected, and it did not measure FSIQ.
According to his biographer, in high school, the brilliant mathematician Richard Feynman's score on the school's IQ test was a 'merely respectable 125' (Gleick, 1992, p. 30). It was probably a paper-and-pencil test that had a ceiling, and an IQ of 125 under these circumstances is hardly to be shrugged off, because it is about 1.6 standard deviations above the mean of 100. The general experience of psychologists in applying tests would lead them to expect that Feynman would have made a much higher IQ if he had been properly tested.
John Carroll, The Nature of Mathematical Thinking, p. 9
His IQ is most likely much higher than 125, but it's impossible to know by how much due to a lack of information. It is common for people to try to use this outlier as a point against the accuracy of IQ; however, a lot of the details regarding Feynman's score are questionable, and no psychologist would consider it to be a representative score.
"Chess skill is strongly correlated with IQ."
- Studies show only a modest correlation between IQ and chess skill, with intelligence explaining a small portion of variance once players reach competitive levels.
- General intelligence matters most for early learning and improvement in chess, but its influence diminishes as experience, practice, and domain-specific knowledge accumulate.
- At higher levels of play, training, and deliberate practice, far outweighs IQ in determining chess performance.
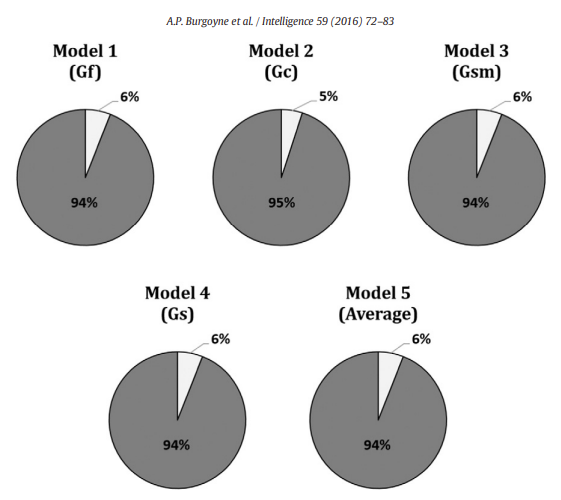
Contrary to the popular trope that "grandmasters are geniuses", the most comprehensive evidence to date shows only a modest link between intelligence and chess skill. Burgoyne et al.'s (2016) meta-analysis combined 82 effect sizes from 1,779 players across 19 studies and found that the broad CHC abilities most often touted as decisive (FRI, WMI, PRI) each correlate with chess performance at roughly r ≈ 0.24–0.25, explaining barely 6% of the variance each57. Full Scale IQ is even worse (r ≈ 0.10), mostly because the rating pools studied are in the upper-normal range.
Intelligence is the most important for children and beginners (r ≈ 0.32) and from there, shrinks for ranked adults (r ≈ 0.11–0.14), showing that g mainly drives early learning, but the amount of time spent on practice, coaching, and knowledge dominates at the higher level.
Chess players such as Kasparov and Judit Polgar have both been tested, and Kasparov scored 135 when he was tested by a magazine that employed psychologists, which is high, but not rare genius level. The data shows that an extra ten IQ points pales beside systematically studying the game when it comes to Elo ratings. While intelligence offers a small but reliable head start, it doesn't substitute for the relentless training that separates grandmasters from weekend players.
"Gould's The Mismeasure of Man makes valid critiques of modern intelligence research."
See our Gould and The Mismeasure of Man (1981) section.
"IQ cannot be predicted using DNA." & Missing Heritability.
-
In 10 years, the ability to predict intelligence from DNA has gone from 0% to 10%. There is room to improve the prediction further, since 10% is only a fraction of the heritability of intelligence, which is at least 50%. This difference is known as the ‘missing heritability’ gap, an issue that confronts all DNA research in the life sciences, not just intelligence.
-
There are commercial companies (like Herasight) that work in conjunction with fertility clinics to make polygenic score predictions on a number of traits in embryos not yet brought to term, so that parents can choose among the embryos.
- For a good, beginner-friendly overview, see Scott Alexander's "Suddenly, Trait-Based Embryo Selection".
References
Jensen, A. R. (1998). The g factor: The science of mental ability. Praeger. https://arthurjensen.net/ ↩︎ ↩︎ ↩︎ ↩︎
Kuncel, N. R., Hezlett, S. A., & Ones, D. S. (2004). Academic performance, career potential, creativity, and job performance: Can one construct predict them all? Journal of Personality and Social Psychology, 86(1), 148–161. https://www.apa.org/pubs/journals/releases/psp-861148.pdf ↩︎ ↩︎
Warne, R. T. (2020). In the know: Debunking 35 myths about human intelligence. Cambridge University Press. https://doi.org/10.1017/9781108593298 ↩︎ ↩︎ ↩︎
Kuncel, N. R., & Hezlett, S. A. (2010). Fact and fiction in cognitive ability testing for admissions and hiring decisions. Current Directions in Psychological Science, 19(6), 339–345. https://gwern.net/doc/iq/2010-kuncel.pdf ↩︎
Strenze, T. (2007). Intelligence and socioeconomic success: A meta-analytic review of longitudinal research. Intelligence, 35(5), 401–426. https://doi.org/10.1016/j.intell.2006.09.004 ↩︎
Campbell, J. P., & Knapp, D. J. (Eds.). (2001). Exploring the limits in personnel selection and classification. Psychology Press. https://doi.org/10.4324/9781410600240 ↩︎
Strenze, T. (2015). Intelligence and socioeconomic success: A study of correlations, causes and consequences (Doctoral dissertation, University of Tartu). University of Tartu. https://dspace.ut.ee/server/api/core/bitstreams/6ea26618-56b2-43a0-8e4a-2586d117cac9/content ↩︎ ↩︎
Waller J. H. (1971). Achievement and social mobility: relationships among IQ score, education, and occupation in two generations. Social biology, 18(3), 252–259. https://doi.org/10.1080/19485565.1971.9987927 ↩︎
Strenze, T. (2015). Intelligence and success. In S. Goldstein, D. Princiotta, & J. A. Naglieri (Eds.), Handbook of intelligence: Evolutionary theory, historical perspective, and current concepts (pp. 405–413). Springer Science + Business Media. https://doi.org/10.1007/978-1-4939-1562-0_25 ↩︎
Bartholomaeus, V., Chronowski, N. H., Santiago, P. H. R., Kuring, J. K., & Sawyer, A. (2025). Equivalence of telehealth and face-to-face administration of the Wechsler Adult Intelligence Scale Fourth Edition (WAIS-IV). The Clinical Neuropsychologist, 39(5), 1073–1096. https://doi.org/10.1080/13854046.2024.2335117 ↩︎
Alva, J. I., Brewster, R. C., Mahmood, Z., Harrell, K. M., Kaiser, N. C., Riesthuis, P., YoungSciortino, K., Brunet, H. E., Johnson, M. E., & Kovach, S. (2025). Are tele-neuropsychology and in-person assessment scores meaningfully different? A systematic review and meta-analysis. The Clinical Neuropsychologist, 39(5), 1037–1072. https://doi.org/10.1080/13854046.2025.2493343 ↩︎
Hamner, T., Salorio, C. F., Kalb, L., & Jacobson, L. A. (2022). Equivalency of In-Person Versus Remote Assessment: WISC-V and KTEA-3 Performance in Clinically Referred Children and Adolescents. Journal of the International Neuropsychological Society : JINS, 28(8), 835–844. https://pmc.ncbi.nlm.nih.gov/articles/PMC9026666/ ↩︎
Young, S., & Keith, T. Z. (2020). An examination of the convergent validity of the ICAR16 and WAIS-IV. Journal of Psychoeducational Assessment, 38(8), 1024–1036. https://doi.org/10.1177/0734282920943455 ↩︎
Visser, B. A., Ashton, M. C., & Vernon, P. A. (2006). Beyond g: Putting multiple intelligences theory to the test. Intelligence, 34(5), 487–502. https://doi.org/10.1016/j.intell.2006.02.004 ↩︎
Johnson, W., Bouchard, T. J., Jr., Krueger, R. F., McGue, M., & Gottesman, I. I. (2004). Just one g: Consistent results from three test batteries. Intelligence, 32(1), 95–107. https://doi.org/10.1016/S0160-2896(03)00062-X ↩︎
Gerwig, A., Miroshnik, K., Forthmann, B., Benedek, M., Karwowski, M., & Holling, H. (2021). The Relationship between Intelligence and Divergent Thinking-A Meta-Analytic Update. Journal of Intelligence, 9(2), 23. https://doi.org/10.3390/jintelligence9020023 ↩︎
Jauk, E., Benedek, M., Dunst, B., & Neubauer, A. C. (2013). The relationship between intelligence and creativity: New support for the threshold hypothesis by means of empirical breakpoint detection. Intelligence, 41(4), 212–221. https://doi.org/10.1016/j.intell.2013.03.003 ↩︎
Wai, J., Lubinski, D., & Benbow, C. P. (2005). Creativity and occupational accomplishments among intellectually precocious youths: An age 13 to age 33 longitudinal study. Journal of Educational Psychology, 97(3), 484–492. https://doi.org/10.1037/0022-0663.97.3.484 ↩︎
Robertson, K. F., Smeets, S., Lubinski, D., & Benbow, C. P. (2010). Beyond the threshold hypothesis: Even among the gifted and top math/science graduate students, cognitive abilities, vocational interests, and lifestyle preferences matter for career choice, performance, and persistence. Current Directions in Psychological Science, 19(6), 346–351. https://journals.sagepub.com/doi/10.1177/0963721410391442 ↩︎
Terman, L. M., & Oden, M. H. (1947). The gifted child grows up: Twenty-five years’ follow-up of a superior group (Vol. 4). Stanford University Press. https://gwern.net/doc/iq/high/1947-terman-thegiftedchildgrowsup.pdf ↩︎
Roth, B., Becker, N., Romeyke, S., Schäfer, S., Domnick, F., & Spinath, F. M. (2015). Intelligence and school grades: A meta-analysis. Intelligence, 53, 118–137. https://gwern.net/doc/iq/2015-roth.pdf ↩︎
Poropat, A. E. (2009). A meta-analysis of the five-factor model of personality and academic performance. Psychological Bulletin, 135(2), 322–338. https://edci6300introresearch.pbworks.com/f/poropat+2009+metaanalysis+FFM.pdf ↩︎
Schmidt, F. L., & Hunter, J. E. (1998). The validity and utility of selection methods in personnel psychology: Practical and theoretical implications of 85 years of research findings. Psychological Bulletin, 124(2), 262–274. https://doi.org/10.1037/0033-2909.124.2.262 ↩︎
Credé, M., Tynan, M. C., & Harms, P. D. (2017). Much ado about grit: A meta-analytic synthesis of the grit literature. Journal of Personality and Social Psychology, 113(3), 492–511. https://doi.org/10.1037/pspp0000102 ↩︎
Zisman, C., & Ganzach, Y. (2022). The claim that personality is more important than intelligence in predicting important life outcomes has been greatly exaggerated. Intelligence, 92, Article 101631. https://doi.org/10.1016/j.intell.2022.101631 ↩︎
Gajda, A., Karwowski, M., & Beghetto, R. A. (2017). Creativity and academic achievement: A meta-analysis. Journal of Educational Psychology, 109(2), 269–299. https://doi.org/10.1037/edu0000133 ↩︎
Kim, K. H. (2008). Meta-analyses of the relationship of creative achievement to both IQ and divergent thinking test scores. Journal of Creative Behavior, 42(2), 106–130. https://doi.org/10.1002/j.2162-6057.2008.tb01290.x ↩︎
Wikipedia contributors. (n.d.). Kendall rank correlation coefficient: Case of standard normal distributions. Wikipedia. Retrieved June, 2025, from https://en.wikipedia.org/wiki/Kendall_rank_correlation_coefficient ↩︎
Hudson, K. (2002, November 5). The SAT revolution [Mailing list post]. The Mail Archive. https://www.mail-archive.com/futurework@scribe.uwaterloo.ca/msg05978.html ↩︎ ↩︎
Frey, M. C., & Detterman, D. K. (2004). Scholastic assessment or g? The relationship between the Scholastic Assessment Test and general cognitive ability. Psychological Science, 15(6), 373–378. https://gwern.net/doc/iq/high/smpy/2004-frey.pdf ↩︎ ↩︎ ↩︎
College Board. (1999, April). Coaching and the SAT® I (Research Notes RN-06). https://files.eric.ed.gov/fulltext/ED562660.pdf ↩︎
Sackett, P. R., Kuncel, N. R., Arneson, J. J., Cooper, S. R., & Waters, S. D. (2009). Does socioeconomic status explain the relationship between admissions tests and post-secondary academic performance?. Psychological bulletin, 135(1), 1–22. https://doi.org/10.1037/a0013978 ↩︎
Bouchard, T. J. (2013). The Wilson Effect: The Increase in Heritability of IQ With Age. Twin Research and Human Genetics, 16(5), 923–930. https://doi.org/10.1017/thg.2013.54 ↩︎
Tucker-Drob, E. M., & Briley, D. A. (2014). Continuity of genetic and environmental influences on cognition across the life span: a meta-analysis of longitudinal twin and adoption studies. Psychological bulletin, 140(4), 949–979 https://pmc.ncbi.nlm.nih.gov/articles/PMC4069230/ ↩︎
Conery, M., & Grant, S. F. A. (2023). Human height: a model common complex trait. Annals of human biology, 50(1), 258–266. https://pmc.ncbi.nlm.nih.gov/articles/PMC10368389/ ↩︎
Rushton, J. P., & Jensen, A. R. (2005). Thirty years of research on race differences in cognitive ability. Psychology, Public Policy, and Law, 11(2), 235–294. https://doi.org/10.1037/1076-8971.11.2.235 ↩︎
Haier, R. J., Colom, R., & Hunt, E. (2024). The Science of Human Intelligence (2nd ed.). Cambridge University Press. ↩︎
Vigue, C. L. (2023). Francis Galton. In Research Starters. EBSCO Information Services. https://www.ebsco.com/research-starters/history/francis-galton ↩︎
Jensen, A. R., & McGurk, F. C. J. (1987). Black–white bias in “cultural” and “noncultural” test items. Personality and Individual Differences, 8(3), 295–301. https://arthurjensen.net/ ↩︎
Weiss, L. G., & Prifitera, A. (1995). An evaluation of differential prediction of WIAT achievement scores from WISC–III FSIQ across ethnic and gender groups. Journal of School Psychology, 33(4), 297–304. https://doi.org/10.1016/0022-4405(95)00016-F ↩︎
Neisser, U., Boodoo, G., Bouchard, T. J., Jr., Boykin, A. W., Brody, N., Ceci, S. J., Halpern, D. F., Loehlin, J. C., Perloff, R., Sternberg, R. J., & Urbina, S. (1996). Intelligence: Knowns and unknowns. American Psychologist, 51(2), 77–101. https://doi.org/10.1037/0003-066X.51.2.77 ↩︎ ↩︎
Rushton, J. P., & Jensen, A. R. (2010). The rise and fall of the Flynn effect as a reason to expect a narrowing of the Black–White IQ gap [Editorial]. Intelligence, 38(2), 213–219. https://arthurjensen.net/wp-content/uploads/2022/12/The-Rise-and-Fall-of-the-Flynn-Effect-as-a-Reason-to-Expect-a-Narrowing-of-the-Black%E2%80%93White-IQ-Gap-2010-by-John-Philippe-Rushton-Arthur-Robert-Jensen.pdf ↩︎
Field, Y., Boyle, E. A., Telis, N., Gao, Z., Gaulton, K. J., Golan, D., Yengo, L., Rocheleau, G., Froguel, P., McCarthy, M. I., & Pritchard, J. K. (2016). Detection of human adaptation during the past 2000 years. Science, 354(6313), 760–764. https://doi.org/10.1126/science.aag0776 ↩︎
Akbari, A., Perry, A., Barton, A.R. et al. (2026). Ancient DNA reveals pervasive directional selection across West Eurasia. Nature. https://doi.org/10.1038/s41586-026-10358-1 ↩︎
Collinson, R., Evans, S., Wheeler, M., Brechin, D., Moffitt, J., Hill, G., & Muncer, S. (2016). Confirmatory Factor Analysis of WAIS-IV in a Clinical Sample: Examining a Bi-Factor Model. Journal of Intelligence, 5(1), 2. https://pmc.ncbi.nlm.nih.gov/articles/PMC6526452/ ↩︎
Denney, D. A., Ringe, W. K., & Lacritz, L. H. (2015). Dyadic short forms of the Wechsler Adult Intelligence Scale–IV. Archives of Clinical Neuropsychology, 30(5), 404–412. https://doi.org/10.1093/arclin/acv035 ↩︎
Corrigendum: Mutualistic Coupling Between Vocabulary and Reasoning Supports Cognitive Development During Late Adolescence and Early Adulthood. (2019). Psychological science, 30(6), 955–959. https://pmc.ncbi.nlm.nih.gov/articles/PMC7290411/ ↩︎
Rice, M. L., Zubrick, S. R., Taylor, C. L., Hoffman, L., & Gayán, J. (2018). Longitudinal Study of Language and Speech of Twins at 4 and 6 Years: Twinning Effects Decrease, Zygosity Effects Disappear, and Heritability Increases. Journal of speech, language, and hearing research : JSLHR, 61(1), 79–93. https://pmc.ncbi.nlm.nih.gov/articles/PMC6105080/ ↩︎
Verhoef, E., Allegrini, A. G., Jansen, P. R., Lange, K., Wang, C. A., Morgan, A. T., Ahluwalia, T. S., Symeonides, C., et al. (2024). Genome-wide analyses of vocabulary size in infancy and toddlerhood: Associations with attention-deficit/hyperactivity disorder, literacy, and cognition-related traits. Biological Psychiatry. https://doi.org/10.1016/j.biopsych.2023.11.025 ↩︎
Schmidt, F. L., & Hunter, J. E. (2004). General mental ability in the world of work: Occupational attainment and job performance. Journal of Personality and Social Psychology, 86(1), 162–173. (https://doi.org/10.1037/0022-3514.86.1.162)[https://www.scribd.com/document/513632617/Schmidt-Hunter-2004] ↩︎
Gignac, G. E. (2015). Raven’s is not a pure measure of general intelligence: Implications for g factor theory and the brief measurement of g. Intelligence, 52, 71–79. https://doi.org/10.1016/j.intell.2015.07.006 ↩︎
Collinson, R., Evans, S., Wheeler, M., Brechin, D., Moffitt, J., Hill, G., & Muncer, S. (2016). Confirmatory Factor Analysis of WAIS-IV in a Clinical Sample: Examining a Bi-Factor Model. Journal of Intelligence, 5(1), 2. https://doi.org/10.3390/jintelligence5010002 ↩︎
Canivez, G. L. (2008). Orthogonal higher order factor structure of the Stanford–Binet Intelligence Scales–Fifth Edition for children and adolescents. School Psychology Quarterly, 23(4), 533–541. https://doi.org/10.1037/a0012884 ↩︎
Duff K. (2012). Evidence-based indicators of neuropsychological change in the individual patient: relevant concepts and methods. Archives of clinical neuropsychology : the official journal of the National Academy of Neuropsychologists, 27(3), 248–261. https://pmc.ncbi.nlm.nih.gov/articles/PMC3499091/ ↩︎
Gregory, H. (2015). McNamara’s folly: The use of low-IQ troops in the Vietnam War plus the induction of unfit men, criminals, and misfits. West Conshohocken, PA: Infinity Publishing. https://www.amazon.com/McNamaras-Folly-Hamilton-Gregory/dp/1495805484 ↩︎ ↩︎ ↩︎
Crowe, R. R., & Colbach, E. M. (1971). A psychiatric experience with Project 100,000. Military medicine, 136(3), 271–273. https://pubmed.ncbi.nlm.nih.gov/5005407/ ↩︎
Burgoyne, A. P., Sala, G., Gobet, F., Macnamara, B. N., Campitelli, G., & Hambrick, D. Z. (2016). The relationship between cognitive ability and chess skill: A comprehensive meta-analysis. Intelligence, 59, 72–83. https://doi.org/10.1016/j.intell.2016.08.002 ↩︎