
- The main reason for the Flynn effect is increased familiarity with common test structures among new generations. Improved health is a very small cause, though the gains were still meaningful.
- Since the Flynn effect was test-specific, little to no gains were observed on some highly g-loaded tests, such as the AGCT, Arithmetic, and certain working memory tasks.
- On tests susceptible to the Flynn effect, the underlying constructs are measured more poorly across cohorts (because it's picking up on non-g variance, like familiarity), making scores not directly comparable.
- The underlying construct IQ tests try to measure, g, has not changed, which explains why its heritability and its correlations with life outcomes have not changed in the past half century. In this respect, the Flynn effect is like a rising tide that lifts all ships without changing their relative heights.
- See our Expert Opinion section for the implications on group differences.
Background
The Flynn effect (FE) refers to the slow but substantial increase in IQ scores observed over the 20th century. These raw score gains necessitate the periodic renorming of intelligence tests to maintain a population mean of 100 in new cohorts. While first systematically described by James R. Flynn in 1984 and 19871, the phenomenon of rising scores (often called secular IQ gains) was noted as early as the transition from World War I to World War II. Many studies show this robust trend worldwide, with the effect being strongest in developing nations and currently leveling off in the West. In some wealthy, industrialized nations, the FE has stopped and even reversed, as discussed later in this article.
Strong evidence from over 30 countries indicates a global average increase of approximately 3 IQ points per decade. This comes from a comprehensive meta-analysis2 that included 271 independent samples (4 million individuals from thirty-one countries), recruited and analyzed between 1909 and 2013. As shown in the figure below, the IQ gains vary according to domain (estimated at 0.41, 0.30, 0.28, and 0.21 IQ points annually for fluid, spatial, full-scale, and crystallized IQ test performance, respectively).
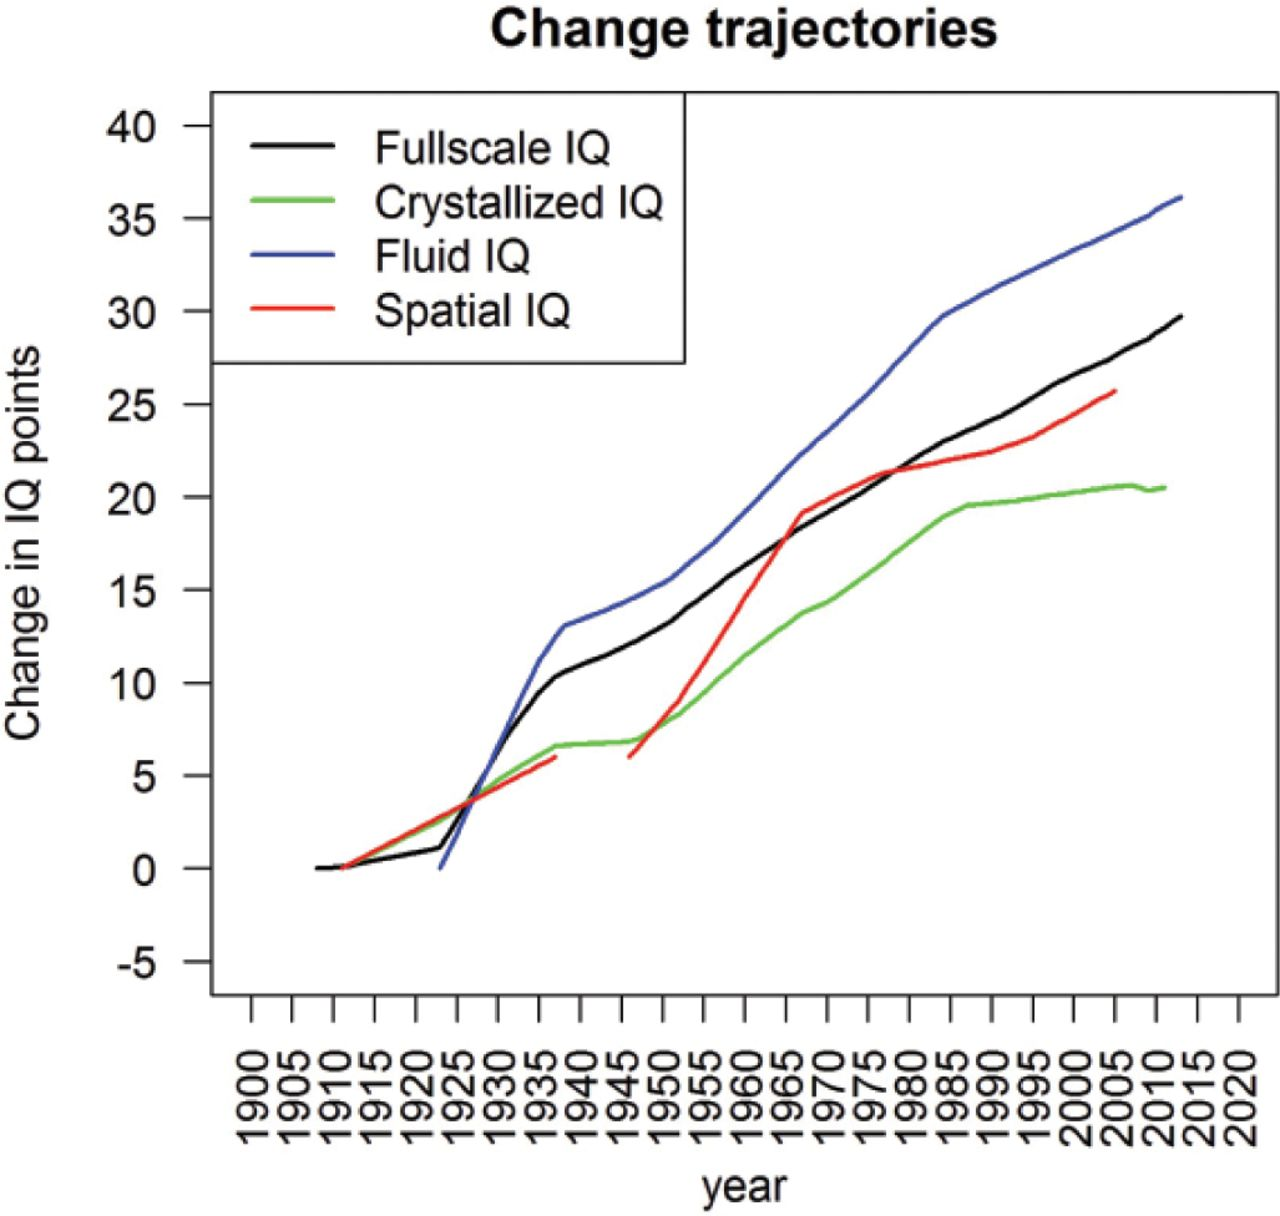
This increase is quite substantial—it suggests a person of average intelligence from 1920 if transported through time to today would score ~70 IQ (lower than 97.7% of the population), which is an approximate criterion (out of many different ones) for being diagnosed with an intellectual disability. Thus, it seems implausible that the Flynn gains solely reflect increases in actual, “real intelligence”; instead, it is likely in part due to artifacts (properties, contents, etc.) of the IQ tests themselves. As a consequence, technically unsophisticated commentators often invoke the Flynn effect to dismiss IQ and/or conclude that IQ scores generally reflect socioeconomic and cultural circumstances. These conclusions are sorely mistaken, as we specifically demonstrate here and here.
Regardless, the FE is relevant to the debate about the malleability of intelligence because it seems very implausible that the IQ increases are genetic in origin, given that human gene pools do not dramatically change that quickly. In the next section, we focus on whether FE gains represent a genuine increase in general intelligence or not. After that, we focus on the major causes of the FE and then outline various minor explanations. Lastly, we substantiate the presence of a reverse FE and a dysgenic trend.
Psychometric Root
Arthur Jensen developed an influential psychometric approach to determining whether Flynn gains are mainly due to gains in test- and/or domain-specific abilities rather than the g factor. The method of correlated vectors examines whether the size of secular gains on individual subtests correlates positively with their g loadings. If Flynn gains reflected true increases in g, they would be expected to form a Jensen effect, meaning that gains would be largest on the most g-loaded subtests. However, a comprehensive meta-analysis, synthesizing results from over 17,000 individuals across 12 datasets, estimated a corrected vector correlation of approximately −0.38 between subtest g loadings and the magnitude of Flynn gains3. This indicates that subtests with lower g saturation tend to show larger secular increases, while highly g-loaded subtests show smaller or negligible gains.
The lack of far transfer to other g-loaded measures also provides strong evidence against general intelligence (and intelligence in any meaningful sense) truly increasing. We cover this in the Reverse Flynn section.
Construct Changes
More recent research directly tests whether Flynn gains correspond to changes in the latent general factor itself. To do this, a 2025 study4 used multi-group confirmatory factor analysis and tests for measurement invariance to reanalyze data from the Norwegian Armed Forces intelligence dataset, which has tested virtually all male conscripts using the same three subtests over several decades: figure matrices, numerical reasoning and word similarities (all multiple choice). The data show that although observed composite scores rose substantially between 1957 and 1993, these gains were driven almost entirely by improvements in figure matrices performance, a fluid-reasoning task known to be especially sensitive to the FE (we explain why later on).
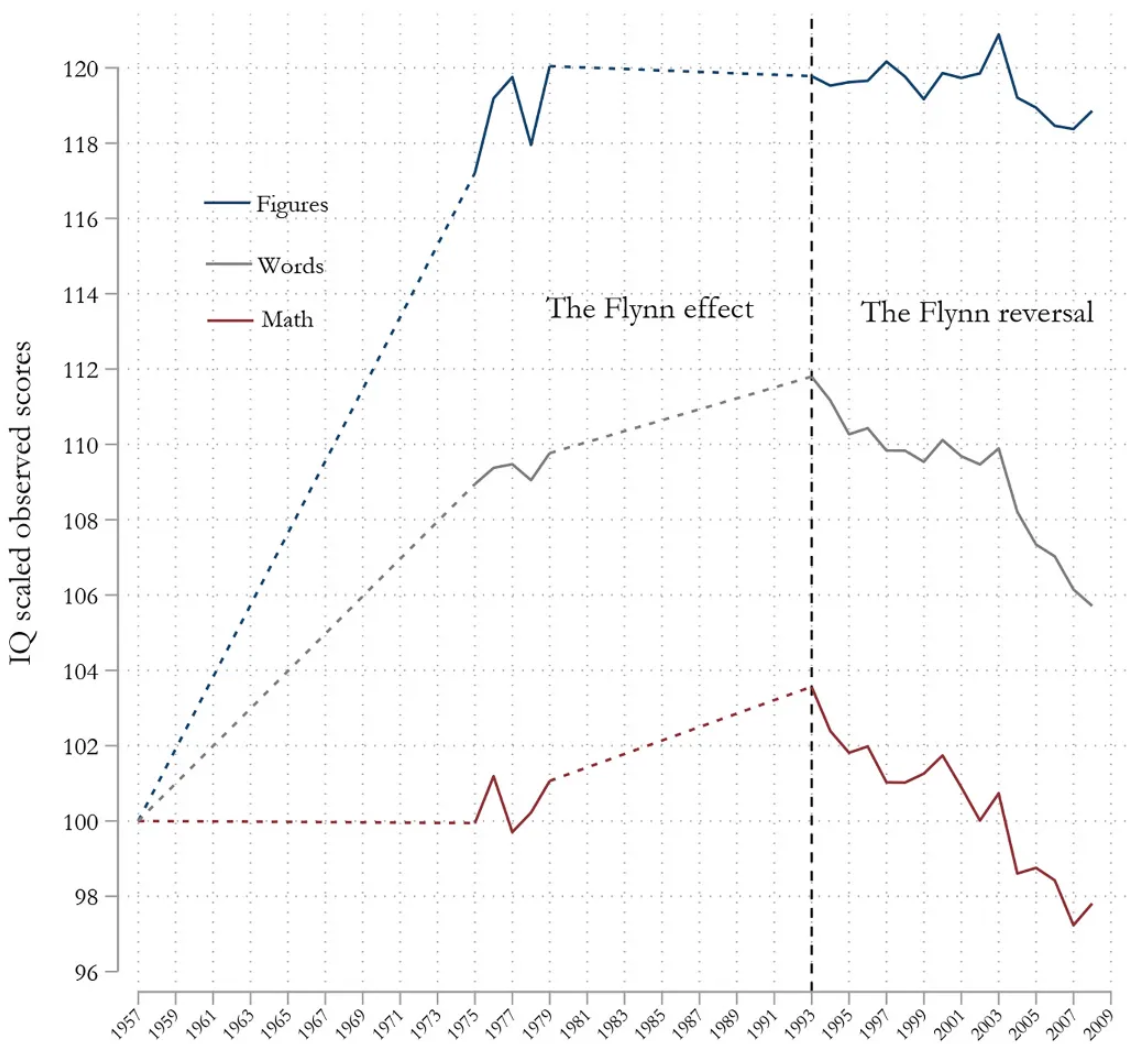
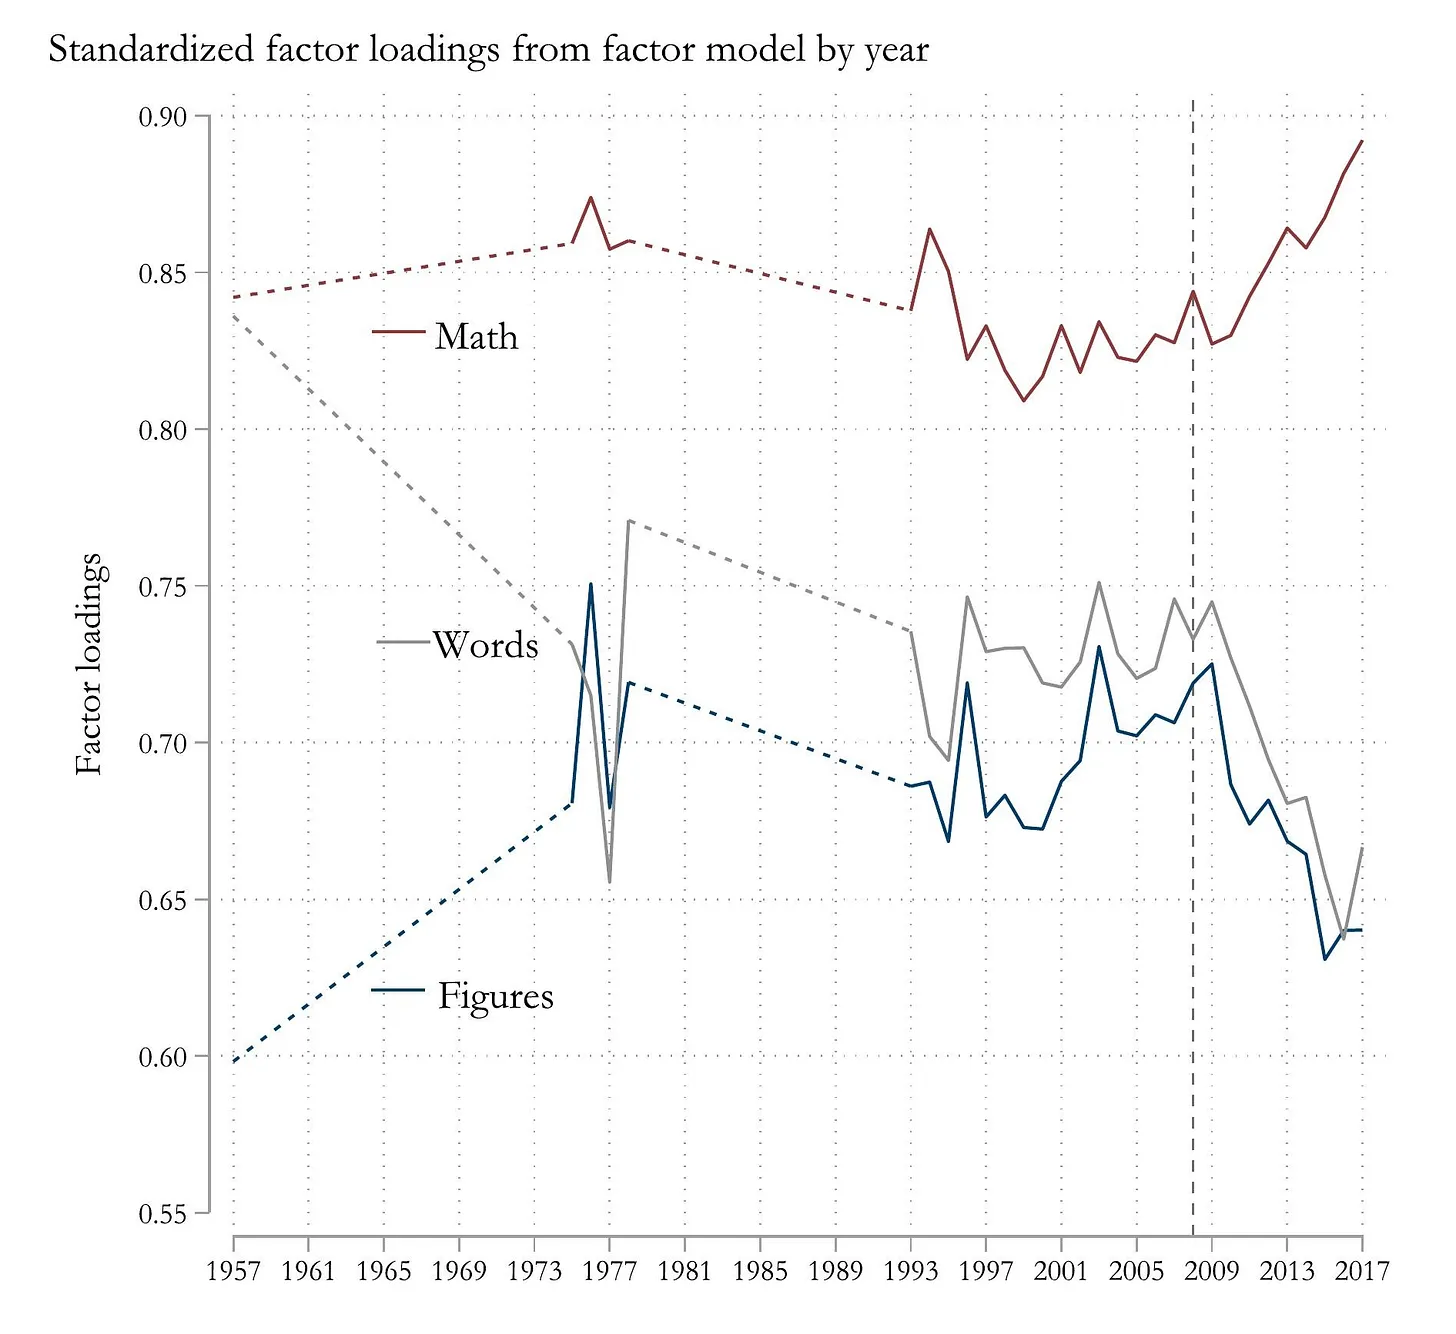
Note. The numerical reasoning subtest is quite similar in content to the math portion of the AGCT, and interestingly, the AGCT shows virtually no FE (see here for wiki section/evidence). With an understanding of the major cause of the FE, it makes sense why this is.
The authors found that measurement invariance was violated across cohorts during the period of rising scores, indicating that the relationship between observed scores and the latent g factor was unstable. With respect to scalar invariance, the best-fitting models attributed most temporal change to subtest-specific effects, with little or no contribution from changes in the general factor4. Moreover, a true increase in g would be expected to manifest as approximately parallel gains across all subtests proportional to their g loadings.
So ultimately, IQ scores do not measure the same abilities in the same proportions in different cohorts, so they are not directly comparable across cohorts and/or long stretches of time. Considerable care to account for cohort effects (FE being the most significant one) is taken in standardizing tests such as the Stanford–Binet and Wechsler tests, as these tests are widely used in clinical practice and to establish legal competency or qualification for special education programs.
Knowledge-based Accounts
In a 2017 survey (N = 75), experts on intelligence research were asked to rate the importance of single, generic causes for the FE5 (25% of whom had specifically studied the FE). The highest rated cause was (1) "Better health", closely followed by (2) "Longer education for more people", (3) "Better nutrition", and (4) "Better education and school-systems". The Flynn experts rated (2) and (4) as the highest, respectively, and overall, the FE was almost-unanimously considered to be solely environmental. We will first lay the foundation for contextualizing specific knowledge-based accounts of the FE, which ultimately explain the majority of the FE.
To explain the FE, Flynn himself has proposed that education (and other aspects of modern life) give people “scientific spectacles” that allow them to think in abstract principles rather than their concrete, everyday reality1. Not formally trained as a psychologist and having a PhD in politics and moral philosophy, Flynn considered himself primarily a philosopher who had simply taken a "holiday" in psychology. Although many of his opinions on psychometrics and g were incorrect and misguided, his general intuition here likely holds merit.
To support his view, Flynn gives the example of peasants from Uzbekistan and Kyrgyzstan who were interviewed in the 1930s by Alexander Luria. At the time, Central Asia was in the early stages of collectivization, so most people were illiterate and led traditional lives, with little to no contact with nearby cities. When given a series of objects, uneducated respondents would stubbornly classify objects by whether they are used together, not by membership in an abstract category. For example, Luria’s team showed respondents pictures of four objects (a hammer, a saw, a hatchet, and a log) and asked which one did not belong. Many uneducated respondents would not recognize that the first three items are all tools and that the log is not6. Here’s a typical exchange between the experimenter and a 39-year-old illiterate respondent:
But one fellow picked three things–the hammer, saw, and hatchet–and said they were alike.
[Illiterate respondent] “A saw, a hammer, and a hatchet all have to work together But the log has to be here too!”
Why do you think he picked these three things and not the log?
[Illiterate respondent] “Probably he’s got a lot of firewood, but if we’ll be left without firewood, we won’t be able to do anything.”
(Luria, 1976, p. 56)7
We cite examples of object classification because it is one of the most basic abstract skills that appear on intelligence tests. In the end, only 4% of illiterate peasants could engage in abstract classification (some with prompting), whereas 70% of “barely literate” collective farm activists could do so, and 100% of young people with 1-2 years of schooling could do so7 6. Furthermore, illiterate Russian peasants in the 1920s couldn't entertain hypotheticals in a way that we take for granted today:
‘Q: There are no camels in Germany. The city of B is in Germany. Are there camels there or not?
A: I don’t know. I’ve never seen German villages. If B is a large city there should be camels there.
Q: But what if there aren’t any in Germany at all.
A: If B is a village there is probably no room for camels.’
(Flynn, 2012, p. 14)1
Flynn interpreted Luria’s results as indicating that abstract thought is not the default way of thinking in humans1. Ideally, they should be experiencing the world of symbols from a young age, which virtually all people living in developed nations are now. Given all this, one might be inclined to say that a major cause of the FE is better/modern education. But this is ambiguous, and the laypeople who tout it often hold many misconceptions of what the data show on education and IQ. Firstly, IQ tests are not mere measures of scholastic knowledge, an important example being Vocabulary tasks. Secondly, early intensive educational interventions do not significantly improve IQ. Thirdly, increases in educational duration after early childhood only noncumulatively increases IQ by a few points, and the effect is probably not on g. So surely the cause is more nuanced and likely occurs early in cognitive development, isn't imparted only through school (but probably largely), and quickly shows diminishing returns. In the next few sections we explain it in detail.
Rule-dependence Theory
Rule-dependence theory posits that the magnitude of FE gains is directly proportional to a test's reliance on the identification and repeated use of specific rule-sets. Once a rule is internalized, performance becomes independent of g and instead relies on the efficiency of reusing that learned rule; this effect is especially pronounced on so-called “culture-free” tests, which are overly reliant on rules. Woodley and colleagues (2014)8 categorized 14 IQ tests into four levels based on their rule integration:
- Level IV (Highest Gains): Tests with few, consistent rules used in the majority of items (e.g., Raven’s Progressive Matrices (RPM)). These show the largest FEs because the rules are easily overlearned and reapplied.
- Level III: No universal rule set. Tests with diverse rules where new ones must be induced at different stages (e.g., Cattell Culture Fair Test).
- Level II (Most Common): Involves many shifting strategies or heuristics rather than specific computational rules (e.g., Block Design, Arithmetic, Picture Completion, Similarities, Comprehension).
- Level I (Lowest Gains): Little to no cognitive scaffolding, dependent upon recalled knowledge or raw mental processing (e.g., Backward Digit Span (see Reverse FE!), Draw-a-Man, ECTs, and Information).
Note. Italics indicate tests that were actually used in the study, while non-italics indicate our best guesses for other important tests.
A small test revealed a ~.6 correlation between an IQ test's position in the rule-dependence typology and the magnitude of the FE gains8. Woodley's typology is far from perfect at accounting for the FE, but the subtest-specific FE graph below indicates that it's fairly good9:
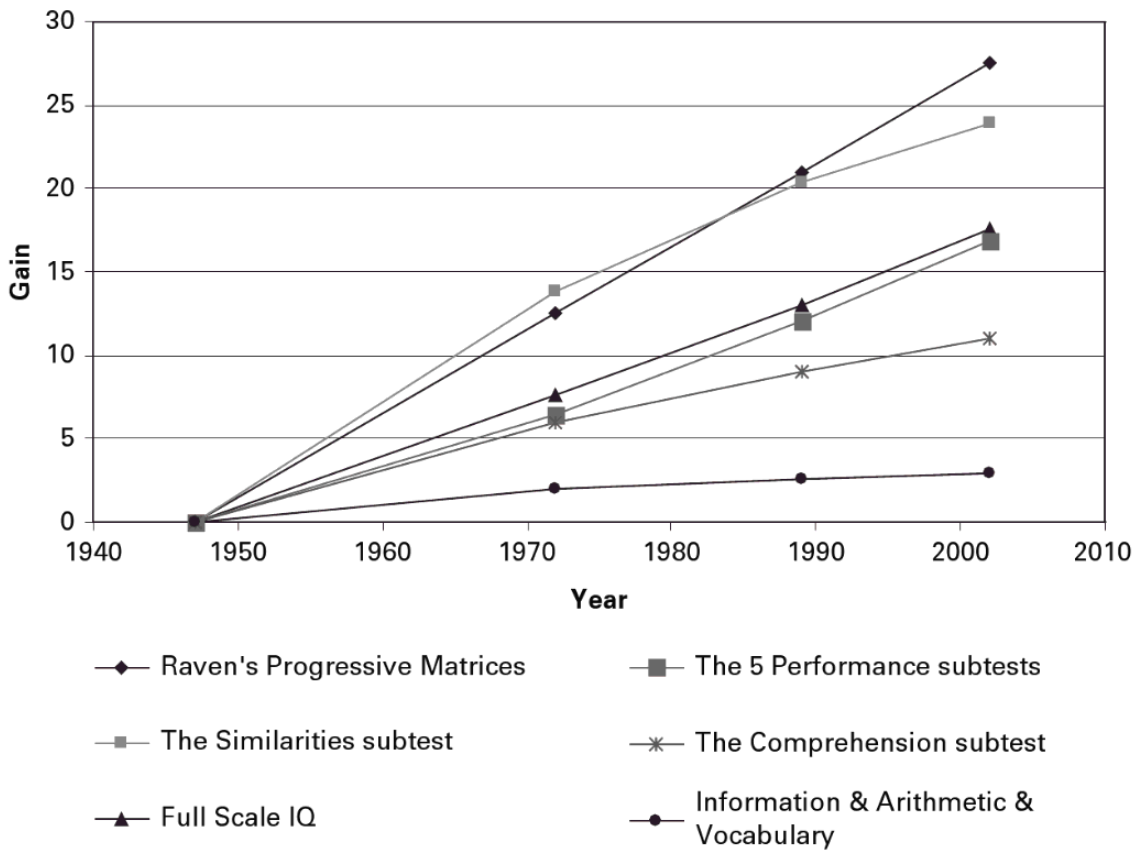
Interestingly, the subtests that show high test-retest jumps for individuals tend to be the same ones with a stronger FE and vice versa8, suggesting they are generally more susceptible to concept exposure. For instance, merely taking the Ravens test can improve one’s score by nearly one standard deviation on the same test as late as 45 days later10, while similar gains do not hold for tests that show minimal FEs.
Analogical Mapping
Fox and Mitchum (2013)11 posit very similar but perhaps more specific cognitive mechanisms that underpin differential Flynn gains. They essentially theorize that the ability to map objects between items has contributed to higher scores, and thus gains should be largest on tests composed of items with a structure that is both initially unfamiliar and relatively uniform from item to item (see here for an explanation with visual aids or here for lots of yap). Accordingly, the lowest gains are observed on subtests consisting of items that resemble schoolwork or scholastic achievement tests, such as Arithmetic, Information (a test of general knowledge), and Vocabulary12. There is little to be gained from mapping objects across items on these subtests, as their structures are already familiar to every test-taker. Even if their structures were unfamiliar, the items call for declarative knowledge that must be acquired prior to the test.
In contrast, subtests that bear little resemblance to traditional schoolwork, such as Similarities, Picture Arrangement (Performance subtest), Block Assembly (Performance subtest), and Coding, show considerably larger gains12, which corresponds with the previous figure. These subtests have problem structures that are relatively uniform throughout and are unfamiliar to most test-takers, and the gains will occur regardless of whether the tests were designed to assess higher-level analogical mapping or not. We will now use Fox's cognitive mechanisms to better understand the FE on the item level for Ravens/matrices.
Matrices
Fox (2011)13 specifically posits that recent cohorts have developed a weak method (a general procedural knowledge structure) for analogical mapping. Matrices specifically lack familiar declarative content, so the FE is driven by procedural know-how. Items on the Raven test can be decomposed according to the number and complexity of rules required for solution (e.g., progression, subtraction, distribution of elements). Fox demonstrated that nearly all cohort gains in pass rates are associated with the level of dissimilarity between objects (a proxy for rule abstraction) in an item (r = .58), rather than the number of rules or general item complexity/difficulty13. Thus, gains scale with the presence of dissimilar elements instead of overall item difficulty, and later cohorts seem to approach the test with more effective initial representations of the task.
Moreover, item-level invariance analyses14 11 of RPM showed that many items violated measurement invariance (as previously discussed in the Norwegian army data). This suggests that members of the later cohort map objects at higher levels of abstraction than members of the earlier cohort who possess the same overall level of ability13 11. As a consequence, in later cohorts the supposed-to-be-novel aspect(s) of matrices and ilk are removed, leading to inflated and less representative scores, and thus they need to be renormed over time and often recreated entirely.
Similarities
A weak method for mapping dissimilar objects seems far better than rule-dependence theory at accounting for the magnitude of the FE on verbal tests, especially on the (WISC) Similarities subtest (typed as Level II in the aforementioned study8), which shows some of the largest FEs. Similarities requires examinees to compare two analogs, such as dusk and dawn13. Answers based on surface similarities such as time of day or intermediate brightness (however they may actually be verbalized) would receive lower scores than answers based on deeper similarities such as separates night and day12. Assuming that examinees are familiar with dusk and dawn, concurrent presentation of these two concepts would elicit others that are common to both such as the examples above. Time of day and intermediate brightness are common objects and roles that may be retrieved spontaneously and offered indiscriminately by a child who does not test for deeper relations. However, weak method mapping makes it possible to generate and evaluate further possibilities. Assuming a skilled problem solver retrieves both time of day and intermediate brightness, they are at least capable of representing them as objects in need of roles13. Ultimately, a greater facility for treating roles as objects can help to explain why today’s average child scores at the 94th percentile of her grandparents’ generation on Similarities12.
Education
What exactly about modern education and its progression has caused later cohorts to be more familiar with common test structures and concepts than earlier cohorts (rule-sets and ilk being a broad proxy)? To make his case for the origin of the weak method, Fox (2011)13 points to a shift in 20th-century curricula (particularly in math and science) from rote repetition to example-based problem solving. The declarative knowledge from yesterday’s math assignment has no bearing on today’s science assignment, but the procedure for mapping new problems to a provided example is governed by the same basic set of analogical productions in either case. Students are now routinely required to map a new target problem to a provided source example, and because the objects in these instances are often dissimilar, they overlearn the procedure for mapping dissimilar objects.
Fox (2011, pdf p. 89)13 cites a thorough analysis of mathematics curricula that concluded that at the turn of the 20th century, much of the mathematics instruction for children in the upper elementary grades was rigid, formalistic, and emphasized drill and rote memorization, but that it has now shifted to inference-based learning, and has placed increasing demands on inductive reasoning since the first half of the twentieth century. All told, an average child in the year 2000 used a textbook with roughly 40 to 60 times as many pages of reasoning content as a child in 1904, while being exposed to abstract material at a younger age.
Minor Causes
Since we have established that Flynn gains show limited far transfer (as we cover more later on) and high domain specificity, the following factors (and all others in general, which don't account for test specificity) will likely have had relatively small impacts. Moreover, environmental variables generally act as threshold or limiting factors. Once basic biological requirements are met (from health/nutrition), further improvements produce diminishing or zero effects on g; they merely allow people to reach their genotypic ceiling.
Health & Nutrition
Over the past half-century, blood lead levels have dropped in industrialized nations2 (see Nutrition/Health wiki article for impact of lead). This factor arguably accounts for a gain of 4–5 IQ points15, which is very meaningful on a population level, but it appears to be limited to gains following the 1970s, as only after this period did restrictions on the use of lead paint and gasoline take effect in most countries. Additionally, brain size in the UK and Germany is larger today than it was a generation ago16, which may be important because brain size is positively correlated with intelligence (r = ~.3). Birth weight, a measure of prenatal health, has increased17, partly due to increases in maternal body mass index, but also due to better medical care and healthier behavior from pregnant women, particularly lower smoking rates during pregnancy. Because the time before birth is very critical in brain development, this may result in the FE being apparent even in very young children18 19.
One important finding is that infant development quotients (quantifications based on behaviors) in the first two years of life show a generational increase of 3.7 points per decade20. Similarly, an increase of 3.9 IQ points per decade was observed in preschool children (aged four to six). These gains are approximately the same as the FE for adults on the Wechsler and Binet tests. This explanation might seem tempting, but DQs suffer from many psychometric weaknesses (low reliability and validity), and a linear, causal chain hasn't been demonstrated and is probably unlikely. The DQ increases could reflect a number of extraneous changes/factors in measurement and interactions. Moreover, if it were true, we wouldn't expect the FE to be almost completely absent from certain kinds of highly g-loaded tasks.
Ultimately, causal explanations focused on the first years of life, such as better prenatal and early postnatal nutrition and health care, likely explain a relatively small amount of the FE, but still probably caused a very meaningful population-level increase in intelligence, particularly in how it develops and expresses itself (the story of lead being one of the most extreme examples). In poor, developing countries, better health/nutrition is a cost-effective way to substantially increase intelligence for millions of children and is already gaining attention in many countries. The single most impactful effort likely being eliminating iodine deficiency, which is the leading cause of preventable mental retardation in the world (see Global Iodine Network).
Height Analogy
An FE-analogue occurred with the average male height in Europeans, which rose about 11 cm from 1870 to 197021, largely because environmentally sensitive components like leg length increased, while highly heritable components like neck and torso length22 have barely changed. Height growth has now stopped in some places, implying the genotypic maximum height has been reached. Similarly, better early-life health has likely boosted the environmentally sensitive components that influence IQ scores. Meanwhile, the core, highly heritable aspect of g has not changed, which explains why the heritability of IQ and its external validity have not appreciably changed in the past 60 years. External validity is indicated by correlations with variables such as SES, scholastic achievement, and job performance. In this respect, the FE is like a rising tide that lifts all ships without changing their relative heights.
Reverse Flynn Effect & Modern Dysgenics
Since the early 2000s, the rise in IQ has stopped in some countries: Denmark, Norway, Finland, the Netherlands, and France. Additionally, the Flynn effect has slowed and may soon stop in Germany, Austria, the United States (see Wait, Where’s the Flynn Effect on the WAIS-5?), Australia, and the United Kingdom2 23. These countries are all industrialized and wealthy with widespread access to quality education (or WEIRD). It seems these countries have reached (or may soon reach) a saturation point where environmental improvements provide no additional boost in IQ19, and thus have reached their maximum genotypic IQ.
Using the aforementioned Norwegian military conscription data, a 2018 study24 examined whether environmental rather than genetic factors could explain both the rise and subsequent reversal of the Flynn effect. The authors exploited a within-family (sibling fixed-effects) design that compares brothers born in different years. Because siblings share parental genes and family background, this method controls for genetic composition, parental education, and upbringing/household. They found that the entire positive FE (1962–1975) and the subsequent decline (post-1975) could be recovered using only within-family variation. After attempting to correct for selective test nonparticipation, the estimated decline within families (−0.33 IQ points per year) closely matched the across-family population decline (−0.34 points per year). This indicates that the reversal cannot be primarily attributed to between-family genetic shifts and thus is predominantly driven by varying environmental factors (the specifics of which elude us for now). This result is expected, given the significant ~3 IQ point decline per decade. But this still leaves open the possibility of relatively minor genetic explanations, especially using data from more specific and diverse tests.
Woodley (2015)25 argues that, as the FE occurs on environmentally influenced (and less heritable) specialized abilities, there is good evidence that general intelligence is actually declining due to genetic reasons. As such, he calls this the ‘Co-occurrence Model’, because both phenomena have ‘co-occurred’ in several Western nations. The proposed explanation for the decline is based on the accumulated effect (starting in the 19th century) of the modest negative correlation between IQ and fertility and the diminishment of selection processes, as seen in the plummeting of the infant mortality rate, before which wealthy/intelligent/genetically-fit people had significantly more surviving offspring and thus passed on their genes more23.
Expert Opinion and Group Differences
We will now briefly reorient and dispel some laypeople's misconceptions about what researchers think of the FE and its relationship to group differences. A complete handling of the enumerated topics is beyond the scope of this article. We can infer what the decades' worth of evidence indicates from surveys of experts' opinions. The aforementioned 2017 survey5 found that experts expected 21st-century IQ increases in currently on-average low-ability regions (Latin America, Africa, India) and in East Asia, but not in the West, with a small decline in the US. Based on a 2016 survey26 (N = 71), experts who have published on international intelligence differences don't think that the FE in low-ability nations will cause national IQ scores to equalize. 87% of respondents stated that genetics was at least partially responsible for international IQ differences, and Genes were rated as the single most important cause for the differences overall, followed by Educational quality and Health.
Aside. Note that national IQ estimates have historically been plagued by test bias and small, unrepresentative samples, but have shown signs of significant improvement. For example, one 2010 reanalysis27 raised the estimate of the median sub-Saharan African IQ from 67 (Lynn’s estimate) to 82, close to the average value observed in the United States (approximately 85). Be wary of world IQ maps that show the former estimate. The CognitiveMetrics IQ map is based on more modern research, but data quality across developing nations remains highly uneven, and thus, the specific IQ values for developing nations are tentative and should be interpreted with caution. Note. For a balanced view on the meaning of national IQs, see Warne (2022). Also/or see his short blog post, "Thoughts on low national IQs, intellectual disability, and data quality".
Furthermore, experts don't think the FE will eliminate persistent average group differences (same age cohort) within the United States. In a 2020 survey28 (N = 102), experts attributed about half of the Black-White IQ difference (which is ~15 IQ points) to genetic factors and the other half to environmental factors on average. It was also found that 84% of intelligence scholars believed that the average IQ gap between African Americans and European Americans was at least partially genetic. Moreover, the FE is not a reason to expect the narrowing of the Black-White IQ gap; in the U.S., there has been no appreciable narrowing of the Black-White IQ (and educational achievement) gap over the last 60 years29 (also see here in Misconceptions).
Far Transfer (WM)
If there is any change in general intelligence, whether an increase or decrease, then an effect should be visible via far transfer to other highly g-loaded abilities. Working memory (WM) is a good candidate: it is a well-established proxy for g and quite culture-fair and heritable. Tests like digit span (DS) and the Corsi block-tapping (CB) test are good measures of WM. Using those WM tasks, a large meta-analysis30 (N = 139,677) spanning several decades examined secular trends. While the authors found positive FEs for forward DS (r = .12) and forward Corsi block span (r = .10), they also found negative trends on backward DS (r = −.06) and backward Corsi block span (r = −.17). These results, shown in the figure below, remained statistically significant after controlling for age, sex, country development level, and testing medium:
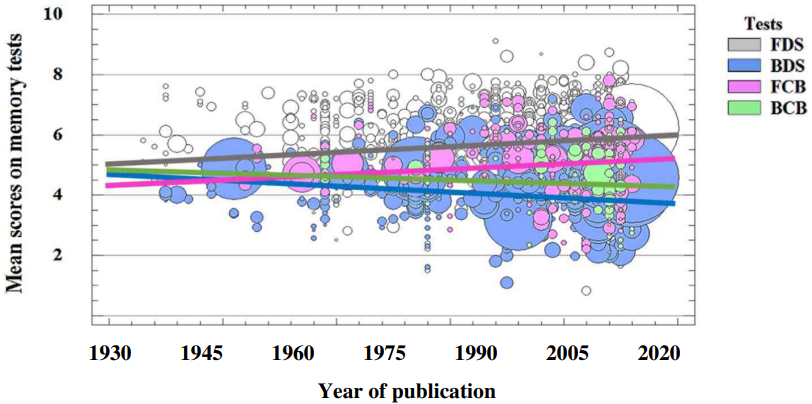
The different trends are understandable; backward tasks require more mental manipulation, which is central to g. This is particularly true for DS, as backwards DS is consistently found to be more g-loaded than forwards DS30. Forwards DS is deemed as more of a measure of storage and attentional control (which has low(er) g-load) and is more susceptible to practice effects. Additionally, backwards tasks are more susceptible to decline with advanced age than forward tasks, which is expected if the former is more related to intelligence30. Ultimately, the FE has shown limited to no far transfer, and the emerging reverse-Flynn trends are most evident in abilities closely related to g and less susceptible to practice effects.
According to Woodley and Dutton (2017)23, the weight of the evidence supports co-occurrence theories that predict simultaneous secular gains in specialized abilities (FE, lower heritability) and declines in g (reverse FE, higher heritability). Now we will move beyond phenotypic evidence, finding more support for the co-occurrence model.
Dysgenics
A 2017 study31 identified a large number of genetic variants that collectively predicted both educational attainment (very rough proxy for intelligence) and g. They called this set of variants POLYEDU (polygenic scores for educational attainment). The authors investigated the effect of this polygenic score on the reproductive histories of 109,120 Icelanders and its impact on the Icelandic gene pool over time. They demonstrated that those who had higher POLYEDU had delayed reproduction and had fewer children than did Icelanders carrying lower POLYEDU. So far, this result is somewhat consistent with previous studies that used polygenic scores for educational attainment to predict fertility outcomes. However, based on a sample of 129,808 Icelanders born between 1910 and 1990, the authors found that the average POLYEDU had been declining at a rate of roughly 0.010 standard units per decade, which, they noted, “is substantial on an evolutionary timescale31.”23
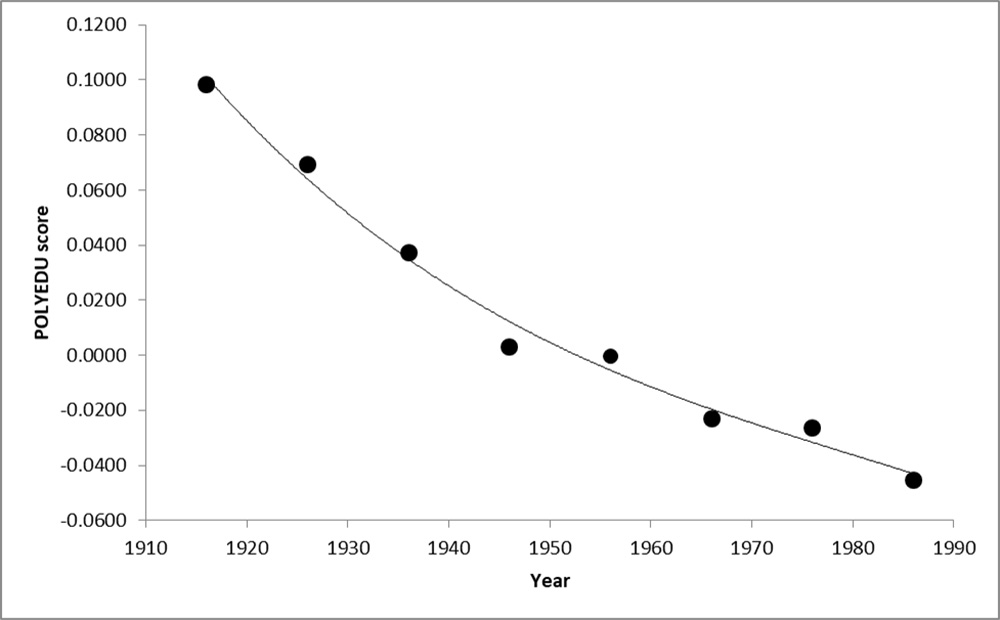
This observed decline over decades in the population’s levels of POLYEDU was found to be highly consistent with the decline predicted using the negative association between POLYEDU and fertility, and the positive association between POLYEDU and age at first birth (those with high IQ don’t simply produce fewer children, they produce them later in life). The resultant IQ loss can be estimated at ~0.7 points per decade, assuming an IQ-heritability of 0.7. The authors added that “because POLYEDU only captures a fraction of the overall underlying genetic component the latter could be declining at a rate that is two to three times faster31.” Ultimately, there is probably a nugget of truth to Idiocracy23.
References
Flynn, J. R. (2012). Are we getting smarter? Rising IQ in the twenty-first century. Cambridge University Press. https://doi.org/10.1017/CBO9781139235679 ↩︎ ↩︎ ↩︎ ↩︎
Pietschnig, J., & Voracek, M. (2015). One century of global IQ gains: A formal meta-analysis of the Flynn effect (1909-2013). Perspectives on Psychological Science, 10(3), 282-306. https://www.researchgate.net/publication/303125919_One_century_of_global_IQ_gains_A_formal_meta-analysis_of_the_Flynn_effect_1909-2013 ↩︎ ↩︎ ↩︎
te Nijenhuis, J., & van der Flier, H. (2013). Is the Flynn effect on g?: A meta-analysis. Intelligence, 41(6), 802–807. https://www.sciencedirect.com/science/article/abs/pii/S0160289613000226 ↩︎
Nordmo, M., Norrøne, T. N., & Lang-Ree, O. C. (2025). Reevaluating the Flynn effect, and the reversal: Temporal trends and measurement invariance in Norwegian armed forces intelligence scores. Intelligence, 110, 101909. https://www.sciencedirect.com/science/article/pii/S0160289625000121 ↩︎ ↩︎
Rindermann, H., Becker, D., & Coyle, T. R. (2017). Survey of expert opinion on intelligence: The Flynn effect and the future of intelligence. Personality and Individual Differences, 106, 242–247. https://www.sciencedirect.com/science/article/abs/pii/S0191886916310984 ↩︎ ↩︎
Warne, R. T. (2023, April 29). Stupid? No. Unfamiliar? Yes. The meaning of low mean IQs in developing nations. https://russellwarne.com/2023/04/29/stupid-no-unfamiliar-yes-the-meaning-of-low-mean-iqs-in-developing-nations/ ↩︎ ↩︎
Luria, A. R. (1976). Cognitive development: Its cultural and social foundations. Harvard University Press. https://www.amazon.com/Cognitive-Development-Cultural-Social-Foundations/dp/0674137329 ↩︎ ↩︎
Armstrong, E. L., & Woodley, M. A. (2014). The rule-dependence model explains the commonalities between the Flynn effect and IQ gains via retesting. Learning and Individual Differences, 29, 41–49. https://doi.org/10.1016/j.lindif.2013.10.009 ↩︎ ↩︎ ↩︎ ↩︎
Flynn, J. R. (2007). What is intelligence?: Beyond the Flynn effect. Cambridge University Press. https://doi.org/10.1017/CBO9780511605253 ↩︎
Bors, D. A., & Vigneau, F. (2001). The effect of practice on Raven's Advanced Progressive Matrices. Learning and Individual Differences, 13(4), 291–312. https://doi.org/10.1016/S1041-6080(03)00015-3 ↩︎
Fox, M. C., & Mitchum, A. L. (2013). A knowledge-based theory of rising scores on "culture-free" tests. *Journal of experimental psychology. General, 142(3), 979–1000. https://doi.org/10.1037/a0030155 ↩︎ ↩︎ ↩︎
Flynn, J. R., & Weiss, L. G. (2007). American IQ gains from 1932 to 2002: The WISC subtests and educational progress. International Journal of Testing, 7(2), 209–224. https://doi.org/10.1080/15305050701193587 ↩︎ ↩︎ ↩︎ ↩︎
Fox M. C. (2011). A Knowledge-Based Theory of Rising Scores on "Culture-Free" Tests [Doctoral dissertation, Florida State University]. Florida State University Libraries. https://repository.lib.fsu.edu/islandora/object/fsu:183490/datastream/PDF/view ↩︎ ↩︎ ↩︎ ↩︎ ↩︎ ↩︎ ↩︎
Fox, M. C., & Mitchum, A. L. (2014). Confirming the cognition of rising scores: Fox and Mitchum (2013) predicts violations of measurement invariance in series completion between age-matched cohorts. PloS one, 9(5), e95780. https://doi.org/10.1371/journal.pone.0095780 ↩︎
Kaufman, A. S., Zhou, X., Reynolds, M. R., Kaufman, N. L., Green, G. P., & Weiss, L. G. (2014). The possible societal impact of the decrease in U.S. blood lead levels on adult IQ. Environmental research, 132, 413–420. https://doi.org/10.1016/j.envres.2014.04.015 ↩︎
Woodley of Menie, M. A., Peñaherrera, M. A., Fernandes, H. B. F., Becker, D., & Flynn, J. R. (2016). It’s getting bigger all the time: Estimating the Flynn effect from secular brain mass increases in Britain and Germany. Learning and Individual Differences, 45, 95–100. https://www.researchgate.net/publication/287337501_It's_getting_bigger_all_the_time_Estimating_the_Flynn_effect_from_secular_brain_mass_increases_in_Britain_and_Germany ↩︎
Surkan, P. J., Hsieh, C.-C., Johansson, A. L. V., Dickman, P. W., & Cnatingius, S. (2004). Reasons for increasing trends in large for gestational age births. Obstetrics & Gynecology, 104, 720–726. https://pubmed.ncbi.nlm.nih.gov/15458892/ ↩︎
Bassok, D., & Latham, S. (2017). Kids today: The rise in children’s academic skills at kindergarten entry. Educational Researcher, 46, 7–20. https://www.researchgate.net/publication/316629668_Kids_Today_The_Rise_in_Children's_Academic_Skills_at_Kindergarten_Entry ↩︎
Warne, R. T. (2020). In the know: Debunking 35 myths about human intelligence. Cambridge University Press. https://doi.org/10.1017/9781108593298 ↩︎ ↩︎
Lynn, R. (2009). What has caused the Flynn effect? Secular increases in the Development Quotients of infants. Intelligence, 37(1), 16–24. https://doi.org/10.1016/j.intell.2008.07.008 ↩︎
Hatton, T. (2013) How have Europeans grown so tall? Oxford Economic Papers, 66, pp. 349–372. https://www.researchgate.net/publication/228209375_How_Have_Europeans_Grown_so_Tall ↩︎
Susanne, C. (1979) Genetics of human morphological characteristics, in Stini, W. (ed.) Physiological and Morphological Adaptation and Evolution, The Hague: Walter de Gruyter. https://www.abebooks.com/9789027977106/Physiological-Morphological-Adaptation-Evolution-World-9027977100/plp ↩︎
Dutton, E., & Woodley of Menie, M. A. (2018). At our wits' end: Why we're becoming less intelligent and what it means for the future. Imprint Academic. https://www.researchgate.net/publication/361923794_At_Our_Wits'_End_Why_We're_Becoming_Less_Intelligent_and_What_It_Means_for_the_Future ↩︎ ↩︎ ↩︎ ↩︎ ↩︎
Bratsberg, B., & Rogeberg, O. (2018). Flynn effect and its reversal are both environmentally caused. Proceedings of the National Academy of Sciences of the United States of America, 115(26), 6674–6678. https://doi.org/10.1073/pnas.1718793115 ↩︎
Menie, M. A., Fernandes, H. B., José Figueredo, A., & Meisenberg, G. (2015). By their words ye shall know them: Evidence of genetic selection against general intelligence and concurrent environmental enrichment in vocabulary usage since the mid 19th century. Frontiers in psychology, 6, 361. https://pmc.ncbi.nlm.nih.gov/articles/PMC4404736/ ↩︎
Rindermann, H., Becker, D., & Coyle, T. R. (2016). Survey of Expert Opinion on Intelligence: Causes of International Differences in Cognitive Ability Tests. Frontiers in psychology, 7, 399. https://doi.org/10.3389/fpsyg.2016.00399 ↩︎
Wicherts, J. M., Dolan, C. V., & van der Maas, H. L. J. (2010). The dangers of unsystematic selection methods and the representativeness of 46 samples of African test-takers. Intelligence, 38(1), 30–37. https://www.researchgate.net/publication/220018536_The_Dangers_of_Unsystematic_Selection_Methods_and_the_Representativeness_of_46_Samples_of_African_Test-Takers ↩︎
Rindermann, H., Becker, D., & Coyle, T. R. (2020). Survey of expert opinion on intelligence: Intelligence research, experts' background, controversial issues, and the media. Intelligence, 78, Article 101406. https://doi.org/10.1016/j.intell.2019.101406 ↩︎
Rushton, J. P., & Jensen, A. R. (2010). The rise and fall of the Flynn effect as a reason to expect a narrowing of the Black–White IQ gap [Editorial]. Intelligence, 38(2), 213–219. https://arthurjensen.net/wp-content/uploads/2022/12/The-Rise-and-Fall-of-the-Flynn-Effect-as-a-Reason-to-Expect-a-Narrowing-of-the-Black%E2%80%93White-IQ-Gap-2010-by-John-Philippe-Rushton-Arthur-Robert-Jensen.pdf ↩︎
Wongupparaj, P., Wongupparaj, R., Kumari, V., & Morris, R. G. (2017). The Flynn effect for verbal and visuospatial short-term and working memory: A cross-temporal meta-analysis. Intelligence, 64, 71–80. https://gwern.net/doc/iq/2017-wongupparaj.pdf ↩︎ ↩︎ ↩︎
Kong, A., Frigge, M. L., Thorleifsson, G., Stefansson, H., Young, A. I., Zink, F., Jonsdottir, G. A., Okbay, A., Sulem, P., Masson, G., Gudbjartsson, D. F., Helgason, A., Bjornsdottir, G., Thorsteinsdottir, U., & Stefansson, K. (2017). Selection against variants in the genome associated with educational attainment. Proceedings of the National Academy of Sciences of the United States of America, 114(5), E727–E732. https://doi.org/10.1073/pnas.1612113114 ↩︎ ↩︎ ↩︎