
Is the SAT an IQ Test?
The SAT after 1994 is no longer an IQ test, as the College Board deliberately redesigned the test to mirror high school coursework. "Thanks to an unprecedented assault from the head of the University of California system, the College Board (the nonprofit organization that owns the SAT) has begun its biggest overhaul ever of the test"1. In early 1994, the verbal section dropped antonyms, doubled the share of passage-based reading, and the math section began allowing calculators and open-ended responses. These changes were repeated in subsequent updates to the test, diluting its saturation with the general intelligence factor (g). Due to these changes, the modern SAT moved from an aptitude test to a scholastic achievement test, with practice yielding significant gains. However, this wiki will be specifically referring to the SAT forms before 1994, which have been found to be psychometrically equivalent to a Full Scale IQ test.
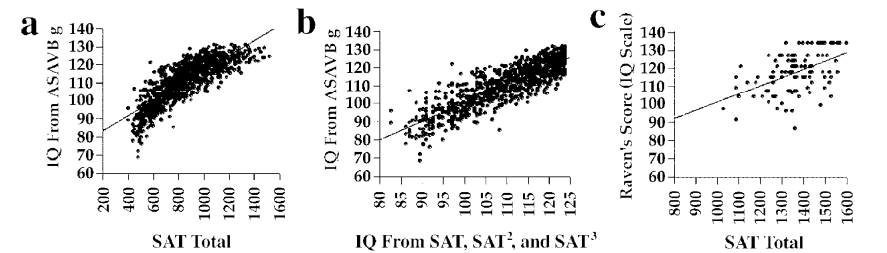
Directly admitted by the College Board president, Gaston Caperton, "in its original form [the SAT] was an IQ test 1." In 2004, Frey & Detterman, using a National Longitudinal Survey of Youth subsample who had taken the old SAT, found the composite score correlated r = 0.82 with g extracted from the ten subtest ASVAB, and r = 0.72 (range-restricted) with Raven's Advanced Progressive Matrices, a well-known fluid reasoning test2.
Furthermore, as pointed out by Frey & Detterman (2004):
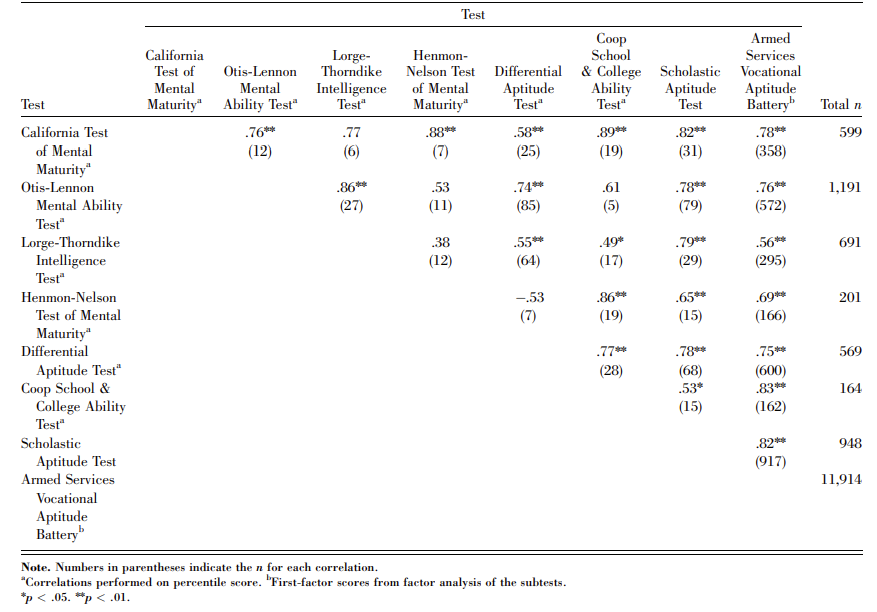
...it is evident from these results that there is a striking relation between SAT scores and measures of general cognitive ability. In fact, when one examines the results in [Fig. 2.], especially those in the ASVAB column, it appears that the SAT is a better indicator of g, as defined by the first factor of the ASVAB, than are some of the more traditional intelligence tests2.
Another independent study of the SAT's value as an IQ test confirms the above findings. In a study of 339 undergraduates, Brodnick and Ree (1995) used covariance structure modeling to examine the relationship between psychometric g, socioeconomic variables, and achievement-test scores. They found substantial general-factor loadings on both the math (.698) and the verbal (.804) SAT subtests2. While they used the SAT itself to define their first factor as g, the evidence strongly suggests it measures the same first factor g as measured by IQ tests. Another thing that should be kept in mind is that these loadings are deflated due to Spearman’s Law of Diminishing Returns (SLODR), as the sample of students who took SATs was above average, college-bound high school graduates, placing them above the average 100 IQ population.
Why is it so Good?
Why was the old SAT so g-loaded? Its creator, Princeton psychologist Carl Brigham, lifted item formats directly from the World War I Army Alpha intelligence tests he developed, meaning the exam's backbone was abstract analogies, antonyms, and logic puzzles that were always intended as an IQ test (and also the exact formats which the post-1994 revisions have removed).
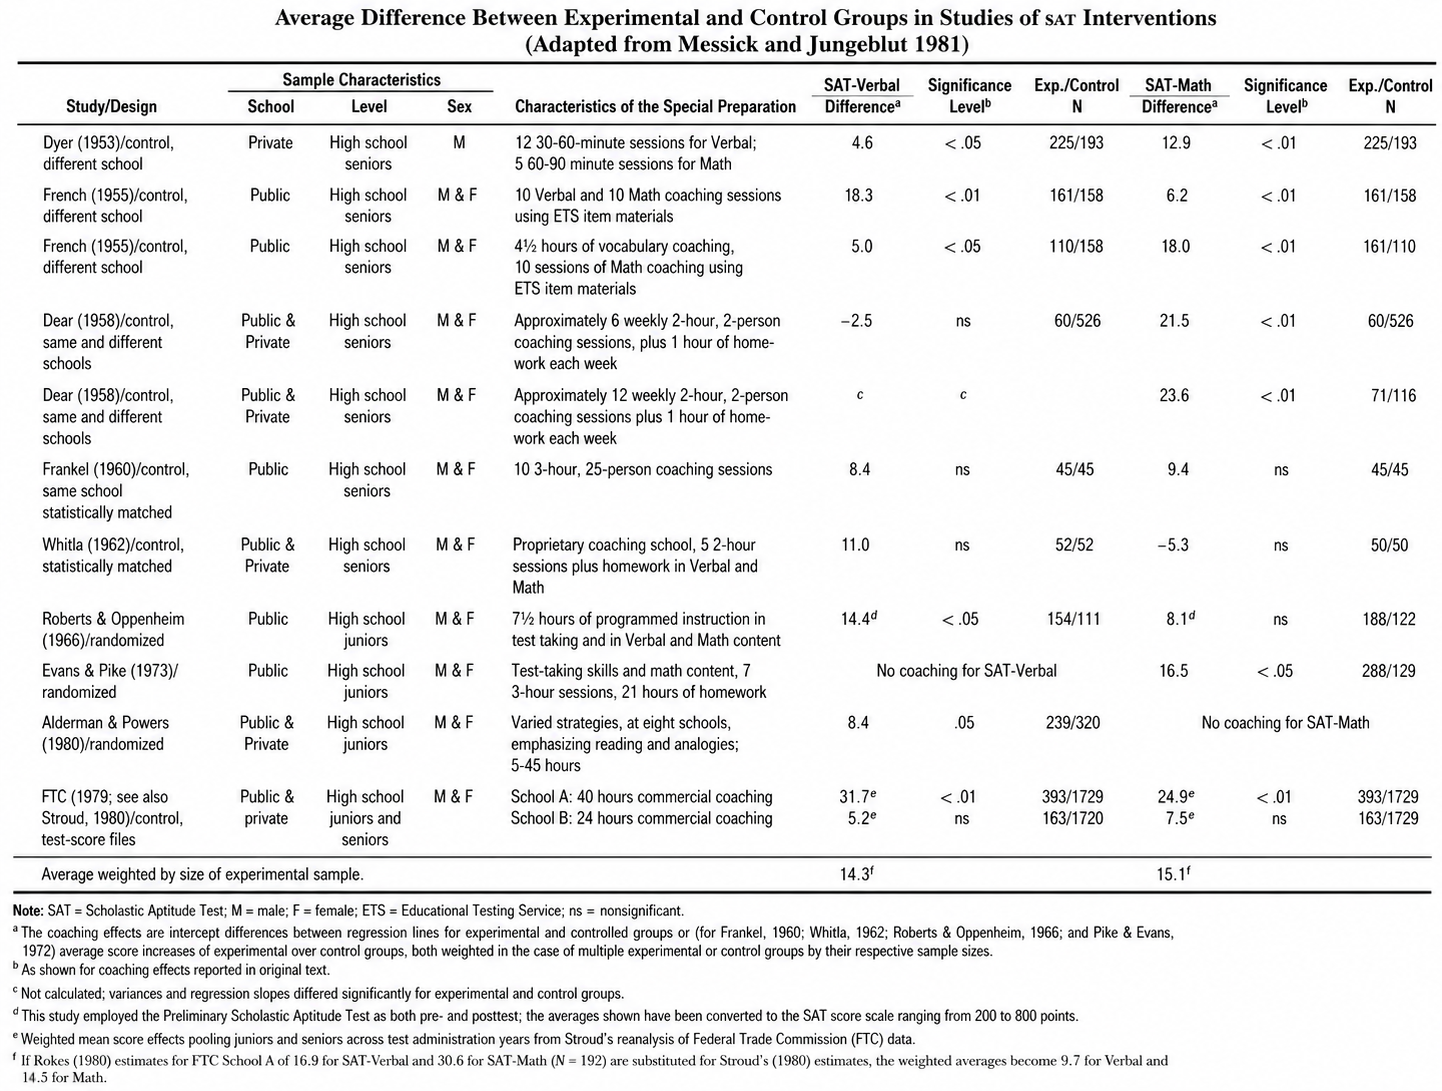
The common objection of the SAT being skewed by the amount of prep time invested by test takers is directly contradicted by large-scale College Board studies, which put coaching gains at ~9-15 (SAT) points on verbal and ~15-18 points on math3. In fact, the trustees of the College Board (1968, p. 8), in an early comment on the studies through 1962, stated,
The evidence collected leads us to conclude that intensive drill for the SAT, either on its verbal or its mathematical part, is at best likely to yield insignificant increases in scores.
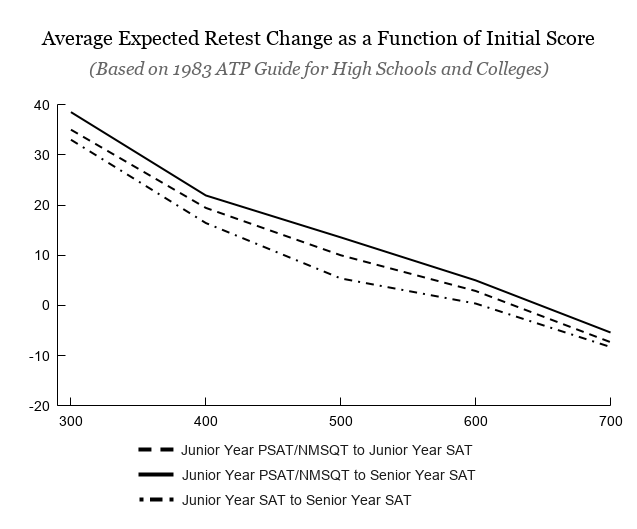
In a message to students, the Board restated this fundamental position in Taking the SAT (1981). As demonstrated in Fig. 3 below4, there are heavy diminishing returns to the amount of time spent in coaching (also see Fig. 7 further down).
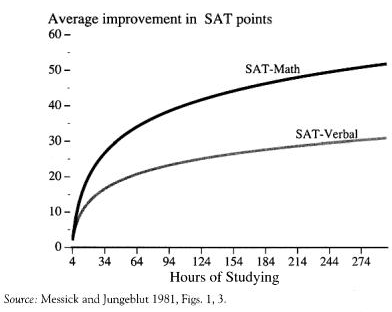
The gains shown above equate to approximately one to six IQ points — far too small to explain uncorrected correlations in the .70-.80 range with independent IQ measures. One major reason the SAT shows less resistance to the practice effect than other tests is its unique property of having multiple parallel forms. Contrast that with most professionally administered IQ tests (such as the WAIS-IV or SB-V), which rely on a single copyrighted form that proctors have to guard. If a client or an internet leak reveals those items, the whole instrument is compromised until the publisher can fund and norm an alternate edition (a process which takes years). By design, the SAT's rotating forms limit any item-specific exposure that inflates retest scores on pro tests. Moreover, it also helps that SAT-V heavily relies on vocabulary (which is highly g-loaded); the WAIS-IV retest data finds that vocabulary tests are one of the most resistant to practice effects. See our section on vocabulary and crystallized items for a comprehensive explanation.
Few IQ tests have ever combined the accuracy of a top-tier FSIQ battery with the scale, form security, and predictive power of the pre-1994 SAT. With multiple peer-reviewed independent studies reporting g correlations on par with how gold standard, professional tests correlate with each other, the old SAT can definitely stand with more conventional IQ tests. However, where the SAT is unique is that, unlike pro tests given to a few thousand volunteers, the SAT was normed on millions of examinees every year and continuously equated every year. A vast, rotating item bank also meant each administration kept coaching effects trivial. Given the SAT's predictive validity with college and even mid-career outcomes in samples exceeding 200,000 students, the old SAT may be the most underappreciated intelligence test ever created. See our dump of figures from the old SAT technical manual for more.
Selection in Colleges
Since World War II, US colleges and universities have incorporated the SAT and the American College Testing Program (ACT) into the admissions process. Both tests are revised and validated periodically by correlating test scores with first-year grade point average (GPA1), cumulative grade point average (GPAC), or probability of graduation within a specified period of time after matriculation (usually four to six years). The old ACT was very similar to the old SAT in that it was a great IQ test, since it had a near-perfect correlation with the old SAT.
A meta-analysis analyzed data provided by the College Board for forty-one colleges and universities where the SAT was used in 1995–19975. More than 155,000 test takers were involved. Three SAT–GPA1 correlations were calculated:
- The uncorrected correlation between SAT and GPA1 in admitted students, calculated within institutions and then averaged across institutions. It was 0.35.
- The correlation between SAT and GPA1 corrected for restriction of range within the applicant population for each institution, and then averaged. This is the predictive correlation that would be of interest to admission officers in each institution. It was 0.47.
- The correlation between SAT and GPA1 corrected for restriction of range of SAT scores across all institutions. This can be thought of as the predictive correlation to be used to determine the benefit of using the test across all participating institutions. It was 0.53.
The predictive validity matters more as selection becomes stricter. For example, if the rejection rate is 90 percent, as it is for some elite universities, the use of the SAT (2) (r = 0.47) improves the GPA in the entering class by about 0.8 standard deviations. In other words, the mean GPA can be improved from the fiftieth percentile in the applicant population (no test used) to about the seventy-seventh percentile (also see here). Also see Fig. 11 in this article.
Controversy
In 2021, the University of California (UC) system decided to stop using the SAT and the ACT despite a recommendation by a faculty committee to keep them in the admissions process. The faculty review found that they were useful predictors of academic success and were not biased against any social group:
Test scores are predictive for all demographic groups and disciplines, even after controlling for HSGPA [high school grade point average]. In fact, test scores are better predictors of success for students who are Underrepresented Minority students (URMs), who are first-generation, or whose families are low-income: that is, test scores explain more of the variance in UGPA [undergraduate grade point average] and completion rates for students in these groups. (p. 4)
The tests help identify disadvantaged students who might otherwise not meet admissions criteria6. They effectively improve equity by providing a common metric that partially offsets grading variability and school quality differences. Moreover, some critics of educational admissions tests assert that the tests measure nothing more than socioeconomic status (SES) and that their apparent validity in predicting academic performance is an artifact of SES. However, the aforementioned meta-analysis on the SAT showed that statistically controlling for SES reduces the estimated test-grade correlation from r = .47 to r = .44. Thus demonstrating that the vast majority of the test academic performance relationship was independent of SES5.
National SAT Averages Converted to IQ (1955-1983)
| Year | SAT-V | SAT-M | V+M |
|---|---|---|---|
| 1955 | 98.5 | 103.1 | 100.9 |
| 1960 | 101.7 | 102.3 | 102.1 |
| 1966 | 102.7 | 100.6 | 101.8 |
| 1974 | 101.0 | 101.4 | 101.3 |
| 1983 | 101.9 | 102.4 | 102.3 |
These are using older norms, but they still show that this test is immune to the Flynn effect.
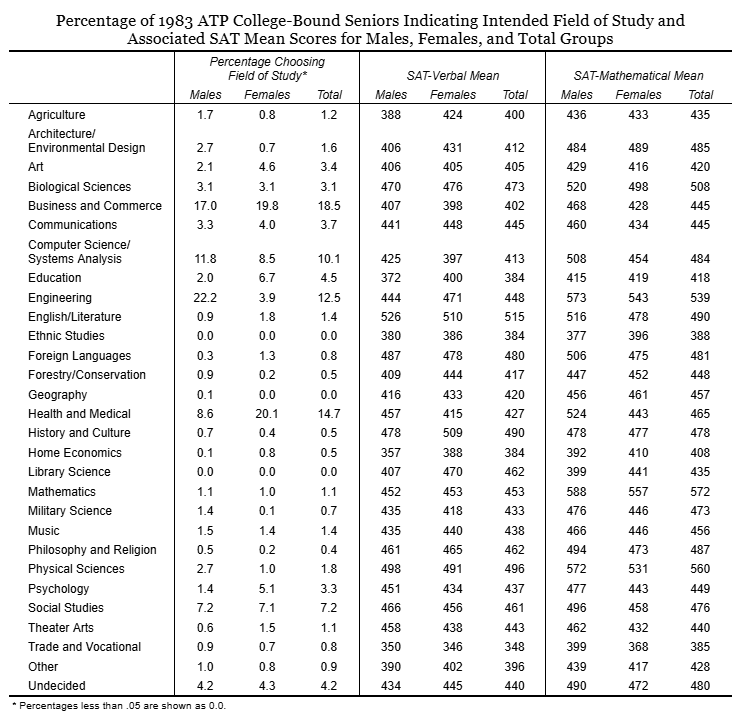
Mean Scores for Intended Majors
The table below7 is specifically for majors that fall under "science, math, and engineering." E.g., law enforcement falls under the social sciences. See Fig. 12 further down.
| Intended Major Field | Average IQ | Mean SATV | Mean SATM | Mean SATV+SATM | Percent Planning Graduate Degree |
|---|---|---|---|---|---|
| Physics | 126 | 558 | 641 | 1199 | 89 |
| Interdis./other sci. | 120 | 520 | 589 | 1109 | 77 |
| Astronomy | 120 | 526 | 578 | 1104 | 86 |
| Economics | 120 | 519 | 576 | 1095 | 81 |
| International rel. | 119 | 544 | 546 | 1090 | 82 |
| Chemical engineering | 119 | 490 | 589 | 1079 | 75 |
| Chemistry | 118 | 500 | 572 | 1072 | 78 |
| Math & statistics | 117 | 469 | 593 | 1062 | 65 |
| Aerospace engineering | 116 | 472 | 555 | 1027 | 63 |
| Political science | 115 | 507 | 515 | 1022 | 76 |
| "Other" engineering | 115 | 460 | 559 | 1019 | 65 |
| Biological sciences | 114 | 480 | 524 | 1004 | 81 |
| Mechanical engin. | 114 | 442 | 543 | 985 | 53 |
| Electrical engin. | 113 | 436 | 543 | 979 | 57 |
| Civil engineering | 113 | 436 | 533 | 969 | 51 |
| Earth & environ. sci. | 112 | 458 | 489 | 947 | 65 |
| "Other" social sci. | 110 | 458 | 467 | 925 | 61 |
| Arch./Environ. engin. | 109 | 419 | 494 | 913 | 56 |
| General psychology | 109 | 448 | 463 | 911 | 78 |
| Computer science | 109 | 413 | 489 | 902 | 46 |
| Social psychology | 108 | 439 | 451 | 890 | 67 |
| Child psychology | 106 | 415 | 428 | 843 | 72 |
| Sociology | 106 | 414 | 429 | 843 | 50 |
| Agriculture | 106 | 404 | 436 | 840 | 31 |
| Law enforcement | 103 | 381 | 408 | 789 | 33 |
Dump of Interesting Figures & Stats
All of the following figures and information are taken from The College Board Technical Handbook for the Scholastic Aptitude Test and Achievement Tests (1984)8. The book was prepared and produced by the Educational Testing Service (ETS), which develops and administers the tests of the Admissions Testing Program (ATP) for the College Board. It is evident that a truly astonishing amount of effort was put in the construction and validation of the SAT.
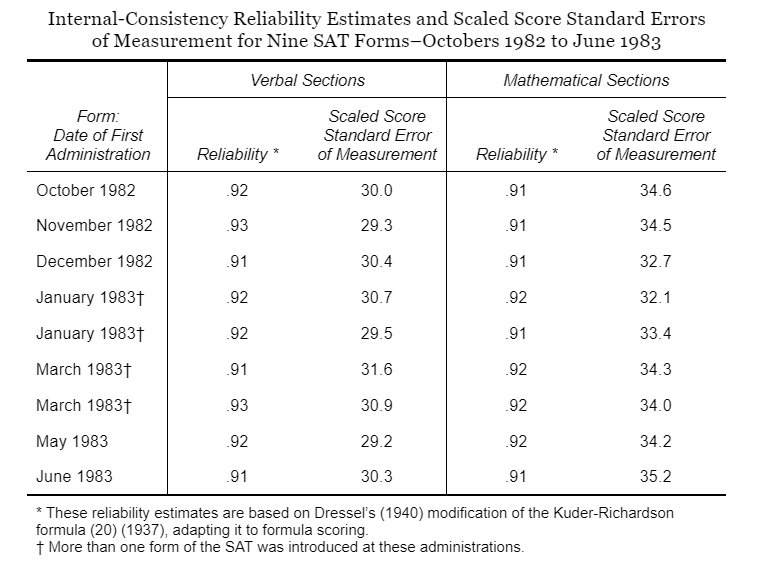
Reliability, Stability & Coaching
Reliability
Test-retest Correlations
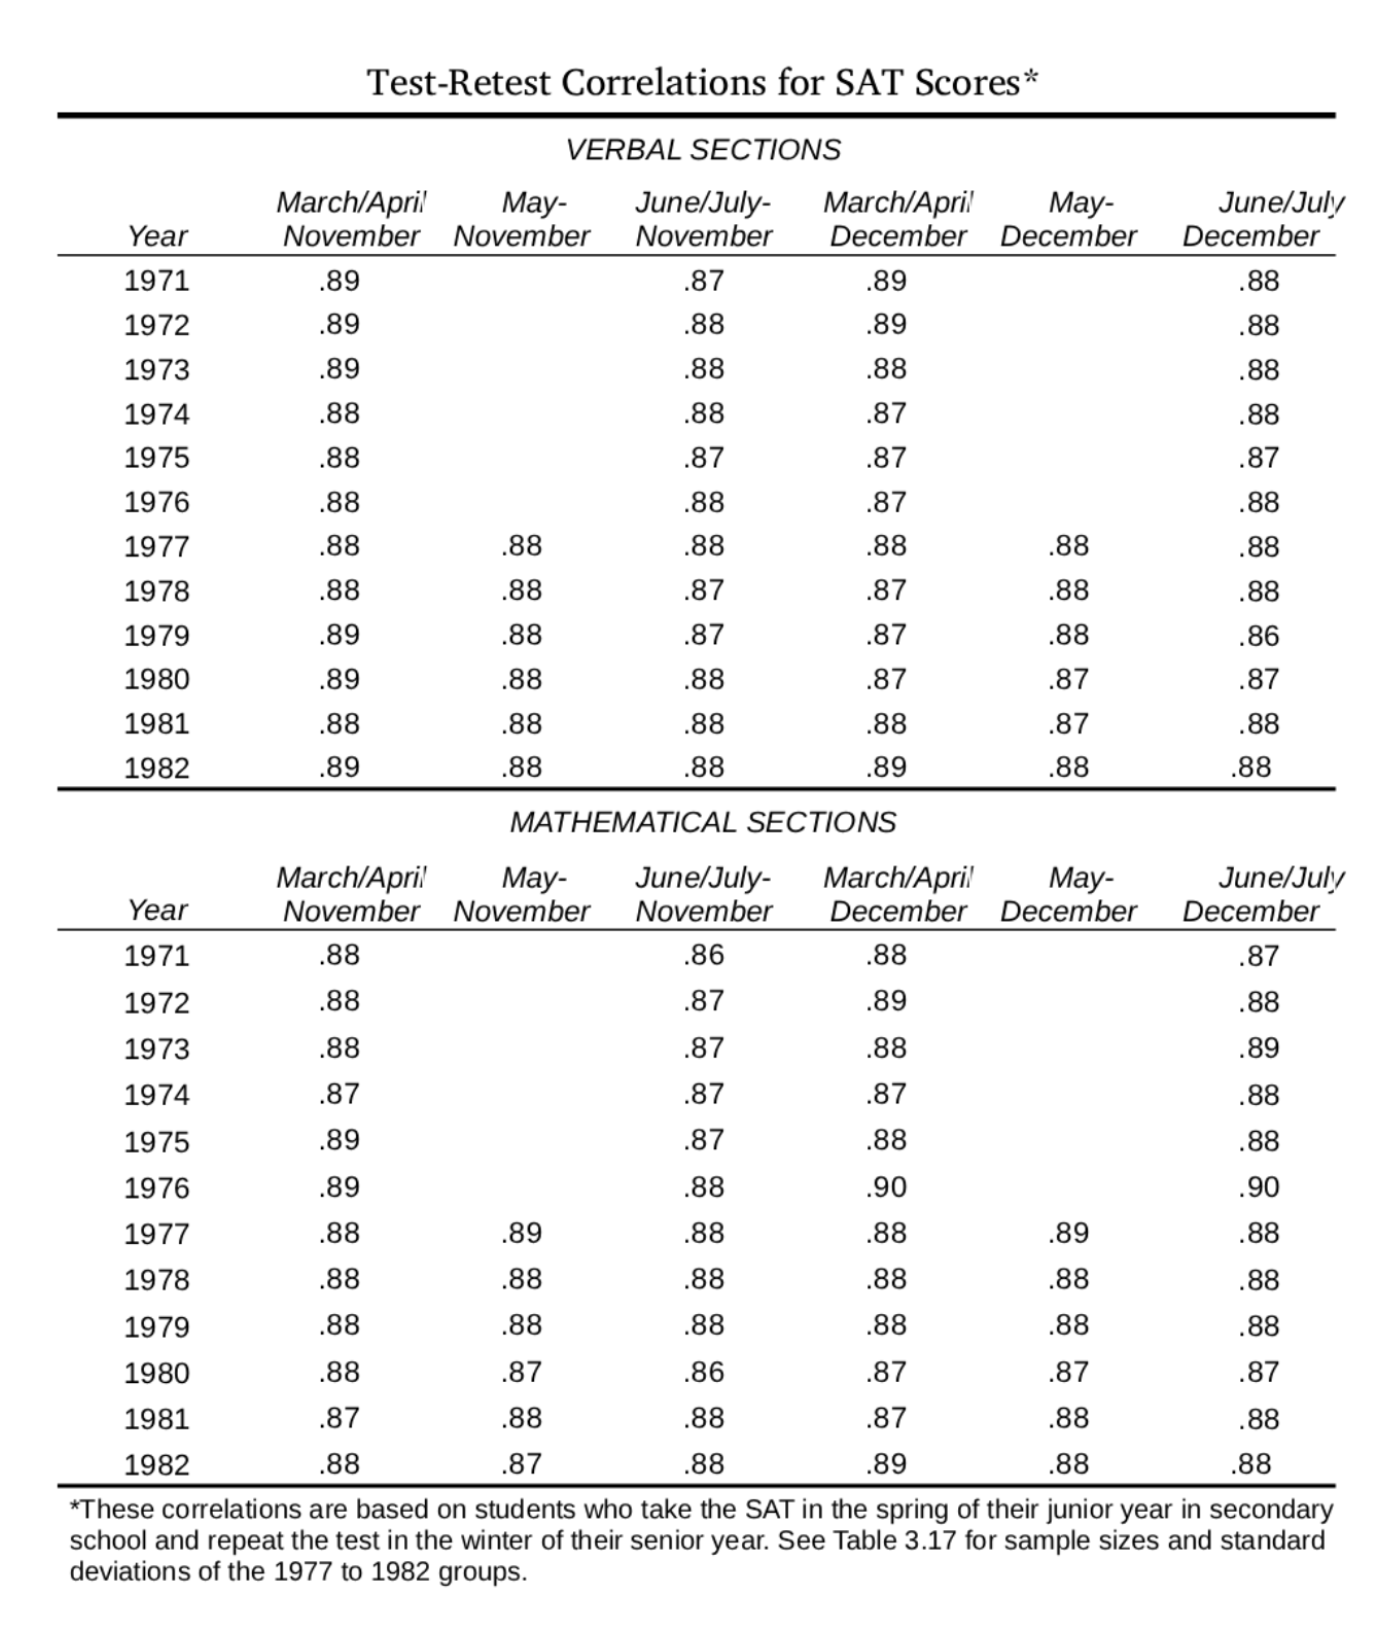
Retest Change
The handbook states that repeating the test (months later) in an effort to raise scores often does not produce the desired result. The percentage of repeating students who receive lower scores on their second testing is around 35 to 40 percent. About 1 student in 20 will show a score increase of 100 points or more; about 1 student in 50 will show a decrease of 100 points or more.
Interventions/Coaching
The handbook notes that the costs in time and money associated with efforts to produce gains of ~15-points, when coupled with a fundamental uncertainty as to whether it can be achieved, seem inordinate. However, for those interested in taking old SAT forms today, large increases from merely refamiliarizing oneself with the kind of high school math present on the SAT-M (taking practice forms, etc.) are not uncommon.
Also. Taking the SAT, introduced in 1978, contains a complete test form and answer key, together with extensive comments and advice about the test-taking experience. This booklet was evaluated by Alderman and Powers (1979). They found that students who received it did no better on the test, in terms of the average score, than students who had not received it. Despite this, the reaction of the students was overwhelmingly positive. About 95 percent of the group found the booklet useful.
Age
Aside. How does age affect performance on the old SAT? According to the handbook, Casserly (1982) reported on the results of three validity studies in which "older" entering freshmen, defined as 21 years or over, and "younger" entering freshmen, defined as below 21 years, were identified. The average age for the older students was 23, and the average for the younger students was 19. The mean SAT sums for older and younger students were about the same (939 and 935, respectively). Although younger students had a higher mathematical mean (490 to 469), the reverse was true for the SAT-V mean (445 to 470). The latter result is expected, given the fact that crystallized ability improves with age. The former result may be due to older students' decreased familiarity with high school math.
Misc Form Data
Verbal & Math Correlations
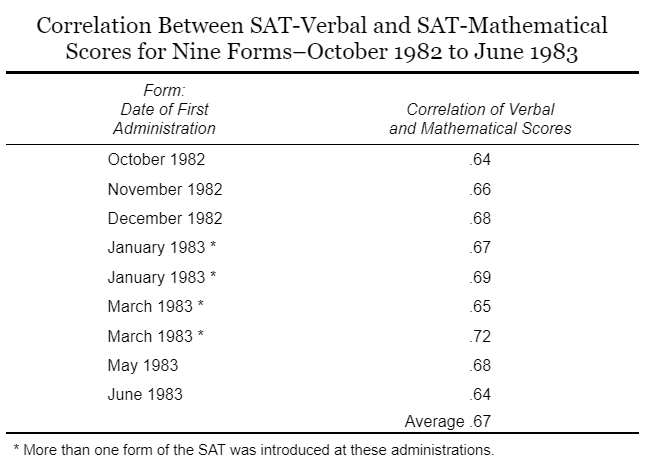
Note. The effort to achieve parallelism among the forms requires well-defined test specifications. This may include (1) the distribution of item difficulties, (2) the average item-test correlations, and (3) the distribution of item content (less rigorous).
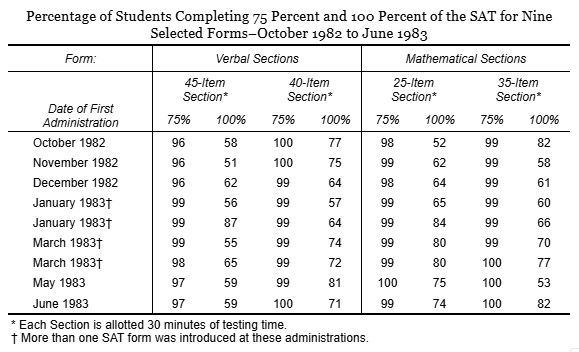
Speededness
Over the years, the old SAT evolved as a power measure, with increasing amounts of time per item for both the verbal and mathematical sections. The measure of 100% completion in the figure below may be misleading, because the last item is typically very difficult and not marked by students, even though they may consider it. In fact, the handbook goes on to show that, on average, students fail to reach only one or two items, with a bit of variation. Ultimately, the SAT isn't really a speeded test.
Antonyms
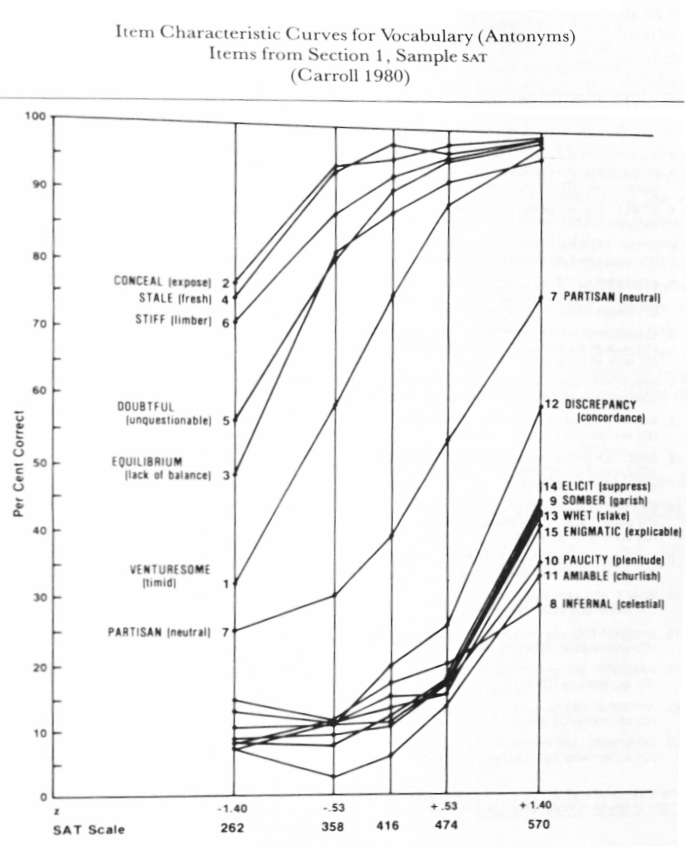
(From the handbook) Carroll (1980) reported (p. 34):
[E]xaminees with SAT[V] scores of 570... can be expected to have no trouble with words like CONCEAL, STALE, STIFF, EQUILIBRIUM, and the keyed correct answers... But, I find it rather disturbing that they tend to have trouble with words like PARTISAN, DISCREPANCY, ELICIT, SOMBER, WHET, ENIGMATIC, PAUCITY, AMIABLE, and INFERNAL. Most of these words and their paired correct answers are likely to occur in the texts students have to read at the college level.
Moreover, no material is included in the SAT without at least one successful pretest, and such a pretest requires that there be some reasonable percentage of correct answers. Obscure words usually fail either because too few people know them, or because they do not identify able students, or both.
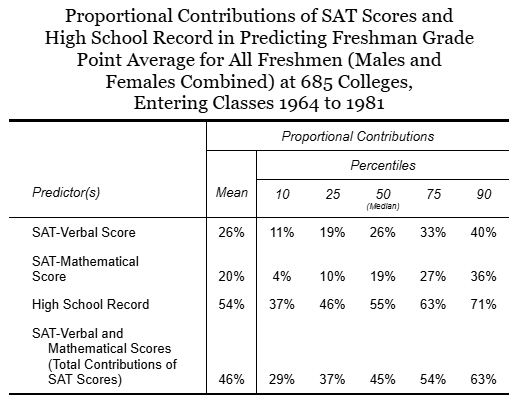
Predictive Validity
Predicting GPA
Means for Intended Field of Study
Score Declines
The score decline refers to the gradual decrease in the average SAT score among students from 1963 to 1979, when scores began leveling off. The College Board and ETS charged a select committee chaired by Willard Wirtz with evaluating the meaning of the decline. As the Wirtz panel summarizes in their report, On Further Examination (College Board 1977, p. 5):
... the decline in score means that only about a third of the 1977 test takers do as well as half of those taking the SAT in 1963 did... [A] decline of this magnitude... is clearly serious business.
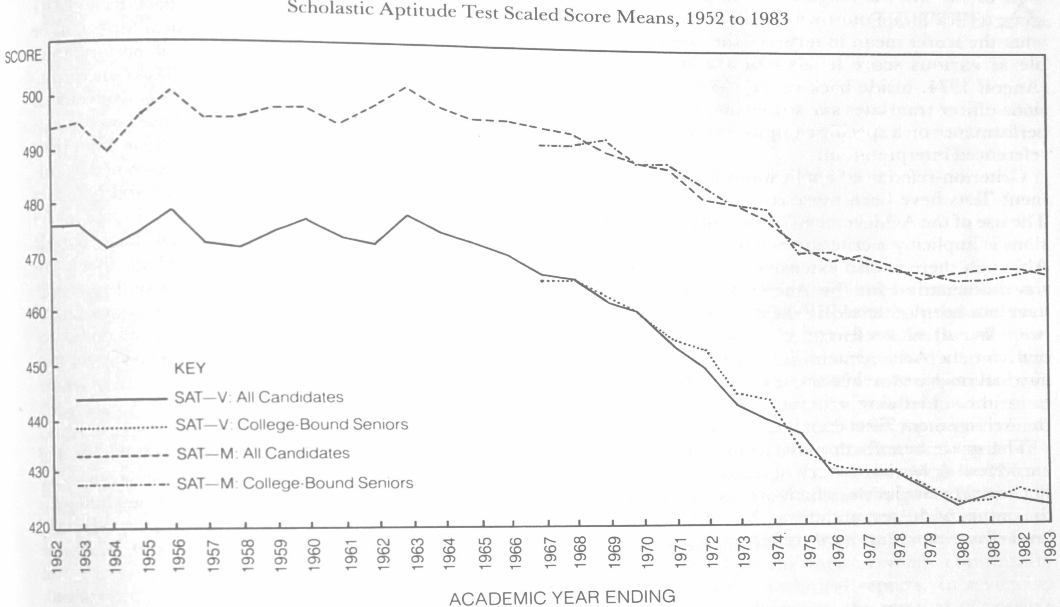
The report made no special claim to have identified the specific causes of the decline, though the Wirtz panel did see population shifts as a significant factor in decline from 1963 to 1973 (e.g., a decreased proportion of college-preparatory students; lower g). Moreover, they found that the significant decline did not affect the SAT's validity as a predictor of individuals' college performance, and that the decline was not an artifact of any changes in the nature or difficulty of the SAT or the result of errors in the scaling and equating processes.
Norms to Convert to IQ
For the most convenient experience, please check out the SAT to IQ Calculator, which converts the SAT Composite and Subtest scores into their IQ equivalents.
Composite Norms
| SAT Composite | IQ | SAT Composite | IQ |
|---|---|---|---|
| 1600 | 166 | 1000 | 114 |
| 1590 | 163 | 990 | 114 |
| 1580 | 161 | 980 | 113 |
| 1570 | 159 | 970 | 113 |
| 1560 | 157 | 960 | 112 |
| 1550 | 155 | 950 | 112 |
| 1540 | 154 | 940 | 111 |
| 1530 | 153 | 930 | 110 |
| 1520 | 152 | 920 | 110 |
| 1510 | 151 | 910 | 109 |
| 1500 | 150 | 900 | 109 |
| 1490 | 149 | 890 | 108 |
| 1480 | 148 | 880 | 108 |
| 1470 | 147 | 870 | 107 |
| 1460 | 146 | 860 | 107 |
| 1450 | 145 | 850 | 106 |
| 1440 | 144 | 840 | 106 |
| 1430 | 143 | 830 | 105 |
| 1420 | 142 | 820 | 105 |
| 1410 | 141 | 810 | 104 |
| 1400 | 140 | 800 | 103 |
| 1390 | 139 | 790 | 103 |
| 1380 | 139 | 780 | 102 |
| 1370 | 138 | 770 | 101 |
| 1360 | 138 | 760 | 101 |
| 1350 | 137 | 750 | 100 |
| 1340 | 137 | 740 | 99 |
| 1330 | 136 | 730 | 99 |
| 1320 | 136 | 720 | 98 |
| 1310 | 135 | 710 | 97 |
| 1300 | 134 | 700 | 97 |
| 1290 | 133 | 690 | 96 |
| 1280 | 133 | 680 | 95 |
| 1270 | 132 | 670 | 95 |
| 1260 | 131 | 660 | 94 |
| 1250 | 130 | 650 | 93 |
| 1240 | 130 | 640 | 93 |
| 1230 | 129 | 630 | 92 |
| 1220 | 128 | 620 | 91 |
| 1210 | 127 | 610 | 90 |
| 1200 | 127 | 600 | 89 |
| 1190 | 126 | 590 | 88 |
| 1180 | 125 | 580 | 87 |
| 1170 | 124 | 570 | 86 |
| 1160 | 124 | 560 | 85 |
| 1150 | 123 | 550 | 84 |
| 1140 | 122 | 540 | 83 |
| 1130 | 122 | 530 | 82 |
| 1120 | 121 | 520 | 81 |
| 1110 | 120 | 510 | 80 |
| 1100 | 120 | 500 | 79 |
| 1090 | 119 | 490 | 77 |
| 1080 | 119 | 480 | 75 |
| 1070 | 118 | 470 | 73 |
| 1060 | 117 | 460 | 71 |
| 1050 | 117 | 450 | 69 |
| 1040 | 116 | 440 | 67 |
| 1030 | 116 | 430 | 65 |
| 1020 | 115 | 420 | 63 |
| 1010 | 115 | 410 | 61 |
| 400 | 58 |
Subtest Norms
| Subtest | Verbal Score | Math Score |
|---|---|---|
| 800 | 159 | 152 |
| 790 | 156 | 149 |
| 780 | 154 | 147 |
| 770 | 152 | 145 |
| 760 | 150 | 143 |
| 750 | 148 | 141 |
| 740 | 146 | 139 |
| 730 | 144 | 138 |
| 720 | 142 | 137 |
| 710 | 141 | 136 |
| 700 | 140 | 135 |
| 690 | 139 | 134 |
| 680 | 138 | 133 |
| 670 | 137 | 132 |
| 660 | 135 | 131 |
| 650 | 134 | 129 |
| 640 | 133 | 128 |
| 630 | 132 | 126 |
| 620 | 130 | 125 |
| 610 | 129 | 123 |
| 600 | 127 | 122 |
| 590 | 126 | 121 |
| 580 | 124 | 120 |
| 570 | 123 | 119 |
| 560 | 122 | 118 |
| 550 | 121 | 117 |
| 540 | 120 | 116 |
| 530 | 119 | 115 |
| 520 | 118 | 114 |
| 510 | 117 | 113 |
| 500 | 116 | 112 |
| 490 | 114 | 111 |
| 480 | 113 | 110 |
| 470 | 112 | 109 |
| 460 | 111 | 108 |
| 450 | 110 | 107 |
| 440 | 109 | 106 |
| 430 | 108 | 105 |
| 420 | 107 | 104 |
| 410 | 106 | 103 |
| 400 | 105 | 101 |
| 390 | 103 | 100 |
| 380 | 102 | 99 |
| 370 | 101 | 98 |
| 360 | 100 | 97 |
| 350 | 99 | 95 |
| 340 | 97 | 94 |
| 330 | 96 | 92 |
| 320 | 95 | 91 |
| 310 | 93 | 89 |
| 300 | 92 | 87 |
| 290 | 91 | 85 |
| 280 | 89 | 83 |
| 270 | 87 | 81 |
| 260 | 85 | 78 |
| 250 | 83 | 75 |
| 240 | 81 | 72 |
| 230 | 79 | 69 |
| 220 | 77 | 66 |
| 210 | 75 | 63 |
| 200 | 72 | 59 |
References
Hudson, K. (2002, November 5). The SAT revolution [Electronic mailing list message]. The Mail Archive. https://www.mail-archive.com/futurework@scribe.uwaterloo.ca/msg05978.html ↩︎ ↩︎
Frey, M. C., & Detterman, D. K. (2004). Scholastic assessment or g? The relationship between the scholastic assessment test and general cognitive ability. Psychological Science, 15(6), 373–378. https://gwern.net/doc/iq/high/smpy/2004-frey.pdf ↩︎ ↩︎ ↩︎
Powers, D. E., & Camara, W. J. (1999). Coaching and the SAT® I (Research Notes No. RN-06). College Entrance Examination Board. https://files.eric.ed.gov/fulltext/ED562660.pdf ↩︎
Messick, S., & Jungeblut, A. (1981). Time and method in coaching for the SAT. Psychological Bulletin, 89(2), 191–216. https://onlinelibrary.wiley.com/doi/epdf/10.1002/j.2333-8504.1980.tb01209.x ↩︎
Sackett, P. R., Kuncel, N. R., Arneson, J. J., Cooper, S. R., & Waters, S. D. (2009). Does socioeconomic status explain the relationship between admissions tests and post-secondary academic performance?. Psychological bulletin, 135(1), 1–22. https://doi.org/10.1037/a0013978 ↩︎ ↩︎
Wittman, D. (2024), The University of California Was Wrong to Abolish the SAT: Admissions When Affirmative Action Was Banned. Educational Measurement: Issues and Practice, 43: 55-63. https://onlinelibrary.wiley.com/doi/full/10.1111/emip.12598 ↩︎
College Board. (1987). Ten-year trends in SAT scores and other characteristics of high school seniors taking the SAT and planning to study mathematics, science, or engineering (Report No. ED289739). ERIC. https://files.eric.ed.gov/fulltext/ED289739.pdf ↩︎
Donlon, T. F. (Ed.). (1984). The College Board technical handbook for the Scholastic Aptitude Test and Achievement Tests. College Entrance Examination Board. https://www.ets.org/research/policy_research_reports/publications/book/1984/bccx.html ↩︎