
- Cognitive ability is ~1.56 times as good a predictor of academic performance as trait conscientiousness.
- The correlation between g assessed at age eleven and an education test factor assessed at age sixteen was 0.81.
- General intelligence tests have a predictive validity of about 0.50 in the workplace (in blue-collar, clerical, and administrative occupations), just as they do in academia.
- A robust longitudinal study shows that IQ scores predict mortality: each major cause of death was higher in the lowest IQ group, with progressively lower rates as IQ increased.
- See figure in Summation of Life Outcomes section and figure in Specific Jobs subsection.
Background
Compelling data support the idea that everyday life can be seen as one long intelligence test, a test that gets progressively harder as modern life becomes more complex1. This article examines research on the relationship between intelligence and life outcomes across three broad domains: academics, the workplace, and personal adjustment. The findings, pithily expressed in the following excerpt, are among the most robust in all of psychological science, largely due to the sophisticated psychometric methods used to overcome the problems inherent to such a complex research problem2.
In no realm of life is g all that matters, but neither does it seem irrelevant in any. In the vast toolkit of human abilities, none has been found as broadly useful – as general – as g. (Gottfredson, 2002, p. 332)3
Researchers estimate the extent to which intelligence, as measured by standardized tests, is related to some criterion variable or index of success by calculating predictive validity, which is defined as the correlation (r) between a measure of intelligence and the criterion measure. The higher the correlation, the better, though the value can be moderate or even small and still be important in practice4. Nevertheless, even with imperfect criterion measures, predictive validity is useful in many circumstances (e.g., selecting applicants)2.
“Success in life” is not a single, well-defined construct. Outcomes such as income, job performance, or health are influenced by many non-cognitive factors (opportunity, personality, mere chance), which necessarily weaken correlations with intelligence. As a result, even moderate correlations (r ≈ .20–.40) should be interpreted as quite meaningful. Expecting very high correlations reflects a misunderstanding of multicausality in real-world behavior. Correlations are central to this article, and given that various misconceptions surround them, some elucidation is warranted.
Correlation Coefficient (r)
Correlations (r's) can simply be interpreted as such: if there is a correlation of 0.30 between $x$ (independent variable) and $y$ (dependent variable), then changing $x$ by one standard deviation will result in a change of 0.30 standard deviations in $y$. The square of the correlation, $R^2$, measures the proportion of variance in the dependent variable (an outcome) explained by the independent variable (e.g., IQ). Some laymen frequently dismiss a "low" correlation like r = .30 as explaining "only" 9% ($R^2$) of the variance. However, this is actively misleading and often nonsensical4.
Interpretation
Firstly, squaring the correlation exaggerates differences between effects. For instance, if one variable has a correlation of .60 and another .30, the first is twice as large as the second. However, their squared variances (36% vs. 9%) suggest the first is four times as important, which grossly exaggerates the real-world difference5 (see blog post for more What does it mean to have a low R-squared ? A warning about misleading interpretation). The correlation coefficient quantifies the relation between two variables in terms of the (standardized) original units, and thus has a natural interpretation with respect to the size of the effect.
Secondly, squaring the correlation obscures its immediate practical value. For instance, meta-analyses put the correlation between IQ and job performance at .386 ($R^2$ = ~14% of variance explained). Given this correlation and assuming bivariate normality, we can use Greiner's Equality to translate the correlation into an intuitive pairwise probability (see here for an example with the equations laid out). The results show that when randomly selecting two workers in the same job, the higher-IQ worker will outperform the lower-IQ worker ~62% of the time. Moreover, binomial effect-size display4 (BESD) provides a direct way to intuitively evaluate effect sizes (see this illustrative blog post that uses BESD to better understand correlations).
See this wiki section for percentiles/details on what constitutes a weak or large correlation in individual differences research.
Statistical Hurdles
Establishing the relationships between intelligence and other measures is sensitive to three statistical concepts2: (1) reliability, (2) range restriction, and (3) power/generalization.
-
Classical test theory (CCT) shows that the maximum observable correlation is bounded by the square root of the reliabilities. Thus, even given that the reliability of IQ (most professional tests) and job performance is ~0.90 and ~0.60, respectively, the observable correlation is capped at ~0.73, even if the true latent correlation were perfect ($r = 1$). Therefore, modest-looking correlations often reflect measurement limits, not weak relationships.
-
Most studies examine selected samples (students, employees, professionals), where variance in intelligence is artificially narrowed. Since correlations depend on variance, restricting the range of IQ or outcomes mechanically lowers r, often by 30–50%. When corrected for range restriction, intelligence–outcome correlations reliably increase (e.g., job performance r ≈ .30 → .45)7.
-
Real-world outcomes are noisy and multiply determined, so detecting intelligence effects requires large samples. Underpowered studies (small $N$) have a high probability of Type II errors (false negatives), leading to false conclusions that there is no relationship. Thus, null findings in small samples tend to be uninformative instead of disconfirming, obligating us to at least not reject the null hypothesis, which is not the same as accepting it.
When studies use large samples, reliable measures, appropriate designs, and long-term outcomes, the relationship between intelligence and life success emerges clearly and consistently1.
Research Designs
The ideal research design is a prospective study, in which the investigator obtains data on people's intelligence at some point in their lives, ideally before they enter an academic program or the workforce, and then assesses how well they succeed (this is usually expensive and difficult). The alternative is a retrospective study (studies of eminence or genius often fall under this), where a group of people is identified who already have varying degrees of success. One of the most ambitious and well-known of such retrospective studies was Simonton’s (2006)8 determination of the correlation between a measure of intellectual capacity, reconstructed from historical records, and historians’ ratings of the performance of the forty-two US presidents, from George Washington through George Bush. The correlation was 0.56.
Summation of Life Outcomes
Many studies of intelligence and life outcomes rely on less-than-ideal proxy measures; e.g., using educational attainment or brief verbal tests to estimate intelligence, or place of residence to approximate socioeconomic status. These aren't necessarily fatal flaws, but they must be taken into account when interpreting results. The same is true for early studies affected by the three aforementioned statistical issues, which tend to attenuate observed relationships rather than create false ones2.
A powerful way to address such limitations is meta-analysis, which synthesizes results across many studies, weighting findings more heavily from larger and higher-quality samples. Meta-analyses use specialized statistical techniques to detect consistent patterns that may be obscured in individual studies. Since included studies vary in quality and rely on different assumptions, meta-analyses are not immune to bias. Nonetheless, many explicitly evaluate this by comparing high- and low-quality studies. Findings that appear only in weaker studies are treated with caution2. Overall, well-conducted meta-analyses provide a strong basis for assessing the weight of evidence. Those summarized in the table below6 show that intelligence is consistently correlated with a wide range of life outcomes.
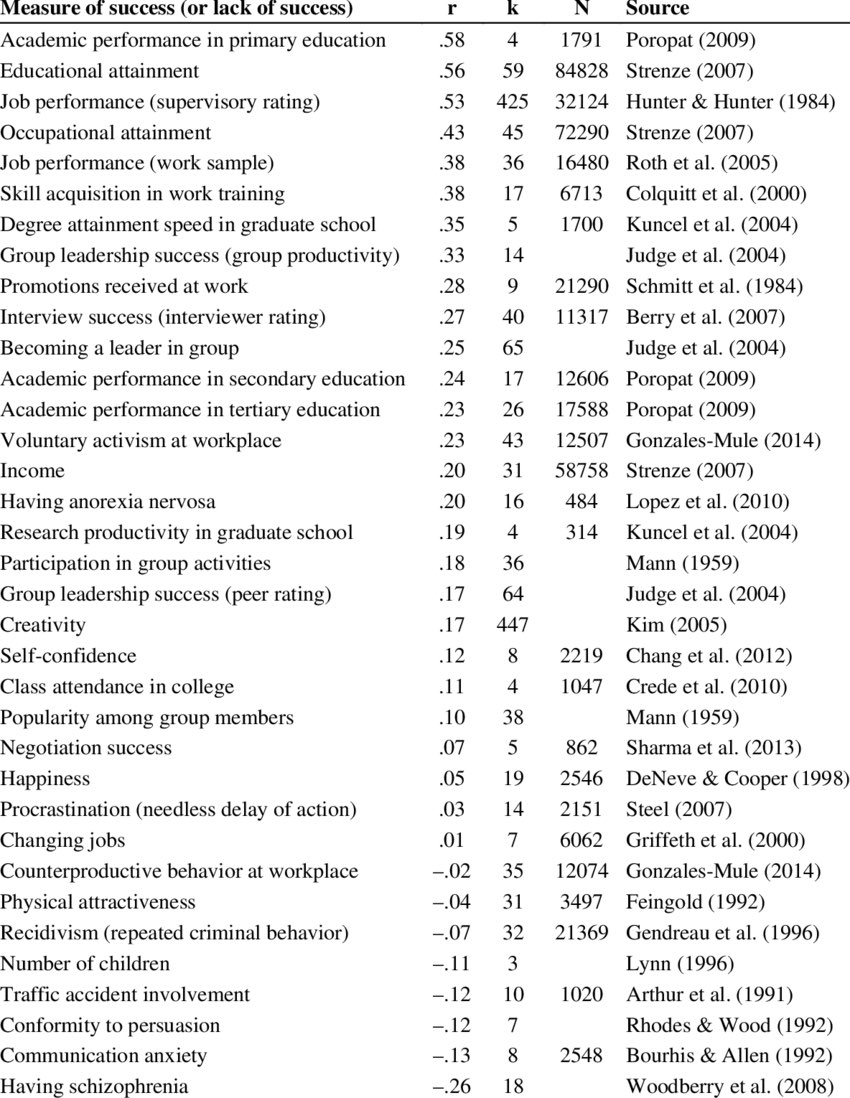
While these correlations are far from perfect, no other psychological variable demonstrates as many strong, replicated associations across such a broad range of real-world outcomes2.
Academic Achievement
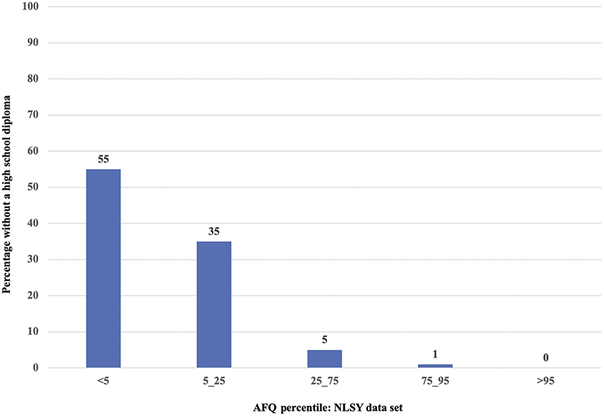
Alfred Binet’s motivation for developing the original intelligence test in 1905 was to identify children at risk of failing in the standard academic system. For example, failure to graduate high school is associated with lower scores on intelligence tests in many studies. An example of the relationship based on a large-sample study is shown in the figure below9. Graduation rates, however, are only a slice of school achievement, and there are many other factors associated with dropouts.
Since World War II, U.S. colleges and universities have used the SAT (Scholastic Aptitude Test) in admission processes. As demonstrated here in the wiki, the pre-1994 SAT is tantamount to an IQ test. The linked article includes a section on selection in higher education and a table showing the mean SAT/IQ scores for various intended college majors.
School Grades
The relationship between intelligence and school grades found in the late 20th century is consistent with findings from the meta-analysis by Sakhavat Mammadov (2021)10 based on 267 independent samples ($N$ = 413,074) recruited for research purposes in the last thirty years. The correlation between intelligence and school grades was r = 0.42. This researcher also computed the meta-analytic correlation between the Big Five dimensions of personality (OCEAN) and school grades. In this case, the values were r = 0.27 (conscientiousness), r = 0.16 (openness to experience), r = 0.09 (agreeableness), r = 0.02 (neuroticism), and r = 0.01 (extraversion). The combined effect of cognitive ability and personality traits resulted in a multiple correlation of .53 with academic performance.
However, in the study, the personality traits themselves are correlated (some with intelligence as well), indicating multicollinearity, meaning the traits share overlapping information. This is why the author used Relative Weight Analysis (RWA) to determine the relative importance of each predictor, rather than relying solely on standard regression coefficients, which can become unstable when predictors are highly correlated. This technique partitions the total variance explained ($.53^2 =$ ~28%) into portions attributed to each predictor, considering both its unique contribution and its contribution when combined with others10. The relative weights (RW%) assigned to the predictors are:
- Cognitive Ability: 63.59% - measures included, but were not limited to, full-scale IQ tests, Raven's Progressive Matrices, and CogAT.
- Conscientiousness: 27.93% - measures self-control, diligence, and attention to detail.
- Openness: 3.94% - measures creativity, curiosity, and willingness to entertain new ideas.
- Neuroticism: 1.88% - measures depression, irritability, and proneness to anxiety.
- Agreeableness: 1.84% - measures kindness, helpfulness, and willingness to cooperate.
- Extraversion: 0.81% - measures boldness, energy, and social interactivity.
While cognitive ability's weight (64%) looks more than double that of conscientiousness (28%), their actual impact on the phenotype (the "effect ratio") is much closer. Using their original correlations, cognitive ability is actually only 1.56 times as influential as conscientiousness ($.42 \div .27$), rather than the 2.29 times suggested by comparing their variance shares ($64 \div 28$)10.
The K–12 system
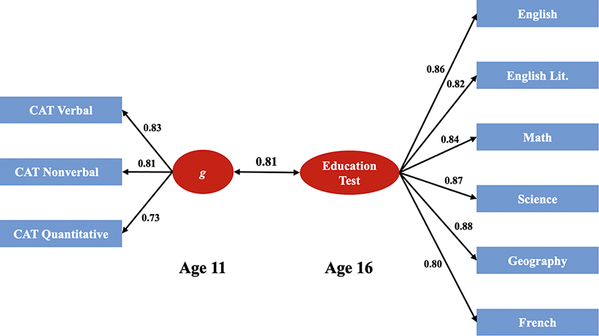
One of the best examples showing the relationship between intelligence and academic achievement is a comprehensive, prospective study from the United Kingdom11. This study sampled an entire population with a battery of intelligence tests and standard achievement assessments across different school subject areas – all in a prospective design. More than 70,000 students completed the Cognitive Abilities Test (CAT, a standardized test battery) in English schools during a school year. The test takers included almost all the eleven-year-olds in England, so range restriction is not relevant. At age sixteen, all the same students took nationwide examinations in a variety of subjects. The national examinations are subject to much more careful psychometric evaluation than is typically the case for locally generated (and certainly for teacher-generated) examinations, so reliability of the criterion variable was not a major concern.
The researchers extracted a general intelligence (g) factor from the CAT scores at age eleven and a general academic achievement factor from the scholastic examination scores at age sixteen (hence the prospective design). The correlation between the two was 0.8111. There was substantial variation in associations between the g-factor and educational accomplishment across individual subject areas. Correlations ranged from a high of 0.77 for mathematics to 0.43 for art and design. In general, the topics usually considered the academic core courses – the humanities, mathematics, and the sciences – had correlations in the 0.50– 0.75 range, while “practical” topics, such as art and design, music, and textiles, had correlations in the 0.4–0.5 range.
Crucially, the validity of g is most conspicuous in scholastic performance, not because g-loaded tests measure specifically what is taught in school, but because g is intrinsic to learning novel material, grasping concepts, distinctions, and meanings. But, as with any complex outcome, other factors must be involved, as the results show. Do other cognitive factors account for any part of this remaining variance?[tk]
The Workplace
Earl Hunt’s (1995)12 book title asked a provocative question: Will We Be Smart Enough? A Cognitive Analysis of the Coming Workforce. In it, he presciently notes:
Three technological changes – computers, communications, and transportation – have combined to produce a workplace where there is an increasingly sharp demarcation between a few good jobs and a large number of mediocre ones. What each of these technologies does is to multiply the effectiveness of a smart person” (p. 284)12.
Certainly, work has shifted from emphasizing the manipulation of objects to manipulating abstract ideas, ranging from programming a robot to analyzing a financial system. Such a facility being central to intelligence2, it seems that intelligence has become progressively more valuable, at least in terms of employment and higher incomes. In fact, the large income/wealth gap we see today likely results in part from individual differences in intelligence and valuable cognitive abilities9. So broadly, how important is intelligence when it comes to success in the workplace13?
Military Enlisted Performance
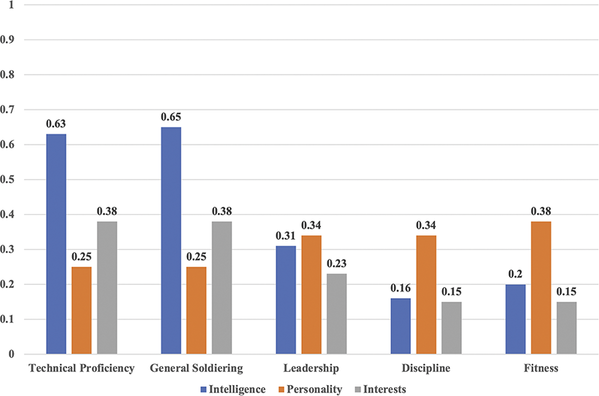
In the 1980s, the US Department of Defense conducted extensive studies of the prediction and assessment of the job performance of enlisted personnel14. The predictive measurements taken included cognitive and personality tests and biographical statements of interest15. Occupational assessments included job performance ratings and records of promotions, commendations, and disciplinary actions. Both pencil-and-paper and hands-on performance tests were given. Examinees had to demonstrate their general skills and knowledge as soldiers, sailors, marines, or airmen, as well as their proficiency in their specific occupations. The occupations chosen ranged from strictly military positions, such as infantrymen and artillerymen, to jobs with exact civilian counterparts, such as automobile mechanics, clerks, and cooks. Generally applying to both the military and civilian workplaces, five dimensions of job performance were identified:
- Two, general military proficiency and technical proficiency in one’s specialty, were “can do” measures. They evaluated how well a person could do their job when they knew that they were being evaluated.
Three factors were “will do” measures:
- Discipline referred to whether the individuals followed regulations and could be relied on to be ready to do their job.
- Leadership referred to the ability to encourage others and to take initiative.
- Fitness referred to personal bearing, appearance, and physical fitness.
The figure below2 shows the relation between the five factors and measures of personality, biographical interests, and cognitive performance (including scores derived from the ASVAB). The cognitive measures were the best predictors, by far, of the two “can do” factors. Interest and personality measures were the best predictors of the “will do” aspects of job performance15.
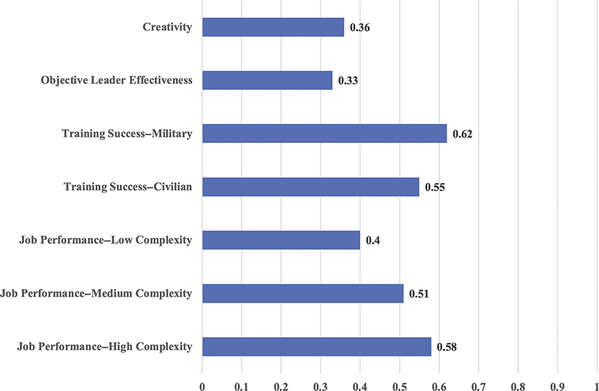
Moreover, Malcolm J. Ree and colleagues (1994)16 used large samples of air force personnel to investigate the importance of the g-factor. They reported that in a sample of more than 78,000 enlistees in eighty-two jobs, g was the best predictor of training success and job performance. This was not surprising, but they also showed that no other variables added appreciably to the prediction, including those related to specific jobs.
The wiki's AGCT article contains tables from Army studies showing the mean AGCT scores for various occupations, occupational groups, types of work, and certain fields of academic specialization.
Civilian Workplace
Two American industrial-organizational psychologists, John Hunter and Frank Schmidt, have conducted a number of widely cited meta-analyses of predicting workplace success. The figure below2, taken from one of their best- known studies17, shows that in the blue-collar, clerical, and administrative occupations, the predictive validity of general intelligence alone, averaged over all studies, is 0.51 (corrected for range restriction and unreliability in the job performance criterion; see also Schmidt et al., 20167). Predictive ability can be raised to a maximum validity by adding a test of integrity to general intelligence (multiple R = 0.65); conscientiousness is a close second (multiple R = 0.60). This illustrates the combined importance of “can do” and “will do” traits.
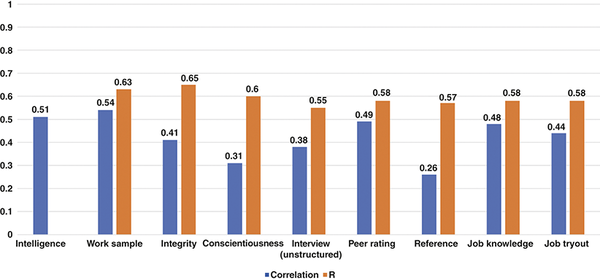
Schmidt et al.’s (2016)7 last review of the evidence revealed that the two combinations with the highest multivariate validity for predicting job performance were general intelligence + integrity (R = 0.78) and general intelligence + structured interview (R = 0.76). The effect size for general intelligence alone was r = 0.65 for overall job performance, whereas the value was r = 0.67 for occupational training performance. He concluded with a warning:
By using selection methods with low validity, an organization can lose millions in reduced production, reducing revenue and profits. Many employers throughout the world are currently using suboptimal selection methods. ... In a competitive world, these organizations are unnecessarily creating a competitive disadvantage for themselves” (p. 49)7.
The correspondence between military and civilian data shows that the findings are robust across different situations and evaluation methods. The military data were gathered by direct observation of young adults; the civilian figures were based on a meta-analysis of dozens of small studies, covering all age ranges, but none as comprehensive or rigorous as the military studies. The results are clear. General intelligence tests have a predictive validity of about 0.50 in the workplace, just as they do in academia. No other method of assessment does appreciably better, although many are widely used[tk continue].
Specific Jobs
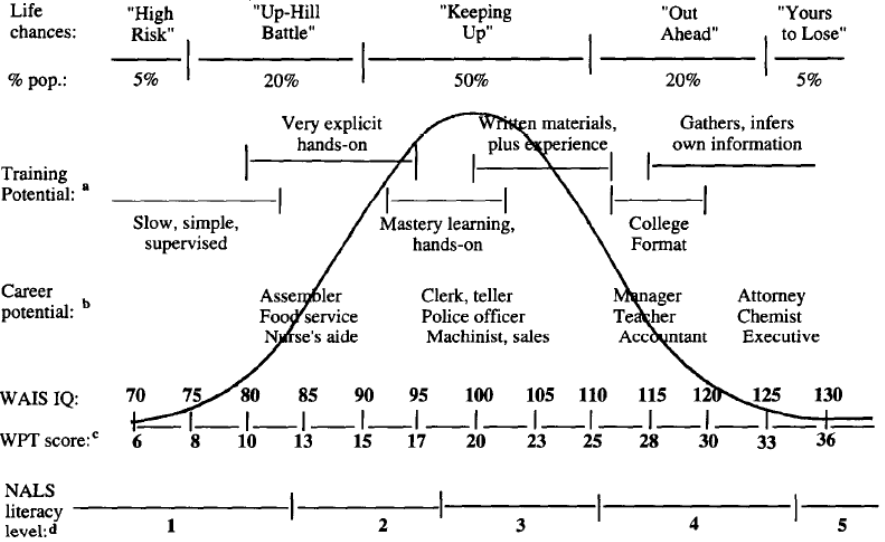
In her classic paper “Why g Matters: The Complexity of Everyday Life,” Gottfredson (1997)1 used intelligence test scores from job applicants to construct a “life’s chances” chart for various occupations. The figure below1 illustrates this and the relationships among IQ, training methods, and jobs estimated by Gottfredson and by the Wonderlic Personnel Test (WPT) as well as the National Literacy Survey (NLS).
The table below shows economic outcomes at different levels of National Adult Literacy Survey (age 16–65 years, White adults). The NALS is highly g-loaded; unlike simple reading tests, the NALS was designed to measure complex information-processing skills and higher-order thinking, such as reasoning and problem-solving, rather than mere recall1. Moreover, the general factor of the NALS correlates .8 with the "academic G" factor of the General Educational Development (GED) exam1.
| Prose level | Scores | Out of labor force (%) | Lives in poverty (%) | Uses food stamps (%) | Employed full-time (%) | Median weekly wages ($) | Employed in professional/managerial job (%) |
|---|---|---|---|---|---|---|---|
| 1 ($\leq$ 85 IQ) | <225 | 52 | 43 | 17 | 30 | 240 | 5 |
| 2 (86-97 IQ) | 226–275 | 35 | 23 | 13 | 43 | 281 | 12 |
| 3 (98-111 IQ) | 276–325 | 25 | 12 | 6 | 54 | 339 | 23 |
| 4 (112-127 IQ) | 326–375 | 17 | 8 | 3 | 64 | 465 | 46 |
| 5 ($\geq$ 128 IQ) | 376–500 | 11 | 4 | 1 | 72 | 650 | 70 |
Note. Most values are percentages. From Kirsch et al. (1993)18.
Personal/Social Adjustment
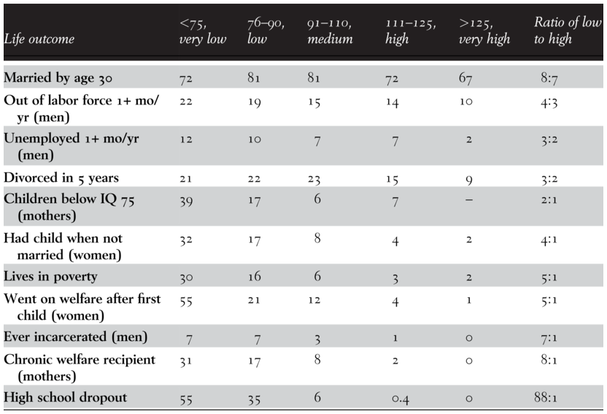
More so than academic and workplace success, the variables used as indicators of adjustment are multidetermined. The table below9 shows that levels of intelligence are associated with several indicators of personal/social adjustment. Whether such data provide insights into the causes of adjustment problems remains an open question, as other potentially confounding variables, such as years of education, are not shown.
Mortality
There is no more definitive health outcome than death, and it is well-established that IQ scores predict mortality. That finding is from the Scottish Mental Survey, which tested virtually every eleven-year- old student in Scotland in 1921 and 1936. A follow-up more than seventy years later identified who was still alive and when and how the others had died. The figure below shows that each cause of death was higher in the lowest IQ group19.
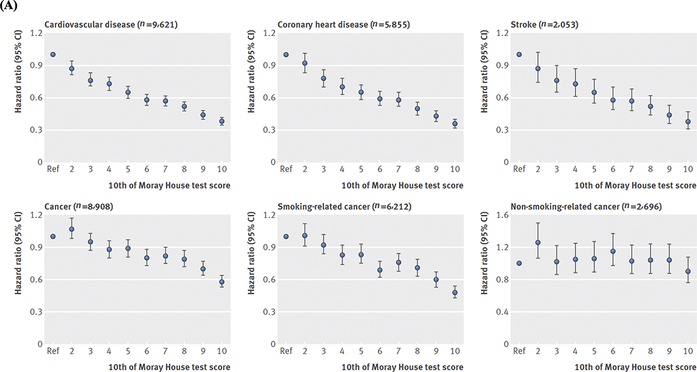
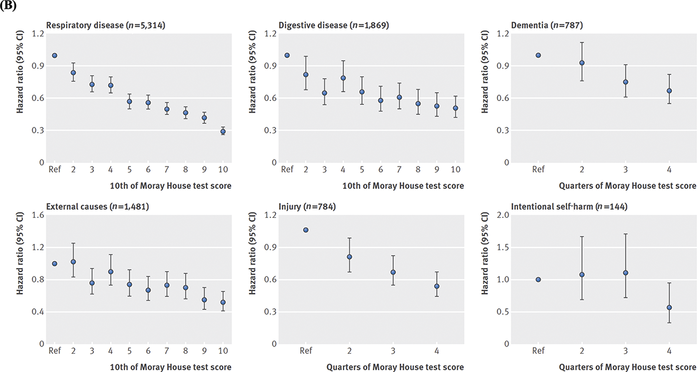
These were surprising differences, since Scotland has a national health care system that includes access for all these individuals. Several other explanations for such associations have been suggested, including a genetic commonality between overall health and IQ20. For now, any causal relationships are a matter of speculation, albeit the empirical fact of their association is robust enough2.
References
Gottfredson, L. S. (1997). Why g matters: The complexity of everyday life. Intelligence, 24(1), 79–132. https://menghublog.wordpress.com/2012/05/20/why-g-matters-the-complexity-of-everyday-life-linda-gottfredson/ ↩︎ ↩︎ ↩︎ ↩︎ ↩︎ ↩︎
Haier, R. J., Colom, R., & Hunt, E. 2023. The Science of Human Intelligence (2nd ed.). Cambridge University Press. ↩︎ ↩︎ ↩︎ ↩︎ ↩︎ ↩︎ ↩︎ ↩︎ ↩︎ ↩︎
Gottfredson, L. S. (2002). g: Highly general and highly practical. In R. J. Sternberg & E. L. Grigorenko (Eds.), The general factor of intelligence: How general is it? (pp. 331–380). Lawrence Erlbaum Associates. https://www1.udel.edu/educ/gottfredson/reprints/2002ghighlygeneral.pdf ↩︎
Funder, D. C., & Ozer, D. J. (2019). Evaluating effect size in psychological research: Sense and nonsense. Advances in Methods and Practices in Psychological Science, 2(2), 156–168. https://journals.sagepub.com/doi/pdf/10.1177/2515245919847202 ↩︎ ↩︎ ↩︎
Del Giudice, M. (2021). Are we comparing apples or squared apples? The proportion of explained variance exaggerates differences between effects. OpenPsych. https://openpsych.net/files/papers/Del%20Giudice_2021a.pdf ↩︎
Strenze, T. (2015). Intelligence and success. In S. Goldstein, D. Princiotta, & J. A. Naglieri (Eds.), Handbook of intelligence: Evolutionary theory, historical perspective, and current concepts (pp. 405–413). Springer Science + Business Media. https://doi.org/10.1007/978-1-4939-1562-0_25 ↩︎ ↩︎
Schmidt, F. L., Oh, I.-S., & Shaffer, J. A. (2016). The validity and utility of selection methods in personnel psychology: Practical and theoretical implications of 100 years of research findings. Personnel Psychology, 69(2), 271-331. https://home.ubalt.edu/tmitch/645/session%204/Schmidt%20&%20Oh%20validity%20and%20util%20100%20yrs%20of%20research%20Wk%20PPR%202016.pdf ↩︎ ↩︎ ↩︎ ↩︎
Simonton, D. K. (2006). Presidential IQ, Openness, Intellectual Brilliance, and Leadership: Estimates and Correlations for 42 U.S. Chief Executives. Political Psychology, 27(4), 511–526. https://www.acsu.buffalo.edu/~jcampbel/documents/SimontonPresIQ2006.pdf ↩︎
Herrnstein, R. J., & Murray, C. (1994). The bell curve: Intelligence and class structure in American life. Free Press. https://lesacreduprintemps19.wordpress.com/wp-content/uploads/2012/11/the-bell-curve.pdf ↩︎ ↩︎ ↩︎
Mammadov S. (2022). Big Five personality traits and academic performance: A meta-analysis. Journal of personality, 90(2), 222–255. https://gwern.net/doc/iq/ses/1990-mchenry.pdf ↩︎ ↩︎ ↩︎
Deary, I. J., Strand, S., Smith, P., & Fernandes, C. (2007). Intelligence and educational achievement. Intelligence, 35(1), 13–21. https://www.researchgate.net/publication/222403422_Intelligence_and_Educational_Achievement ↩︎ ↩︎
Hunt, E. B. (1995). Will we be smart enough? A cognitive analysis of the coming workforce. Russell Sage Foundation. ↩︎ ↩︎
Ones, D. S., Viswesvaran, C., & Dilchert, S. (2005). Personality at Work: Raising Awareness and Correcting Misconceptions. Human Performance, 18(4), 389–404. https://doi.org/10.1207/s15327043hup1804_5 ↩︎
Campbell, J. P., & Knapp, D. J. (Eds.). (2001). Exploring the limits in personnel selection and classification. Lawrence Erlbaum Associates Publishers. ↩︎
McHenry, J. J., Hough, L. M., Toquam, J. L., Hanson, M. A., & Ashworth, S. (1990). Project A validity results: The relationship between predictor and criterion domains. Personnel Psychology, 43(2), 335–354. https://gwern.net/doc/iq/ses/1990-mchenry.pdf ↩︎ ↩︎
Ree, M. J., Earles, J. A., & Teachout, M. S. (1994). Predicting job performance: Not much more than g.. Journal of Applied Psychology, 79(4), 518–524. https://doi.org/10.1037/0021-9010.79.4.518 ↩︎
Schmidt, F. L., & Hunter, J. E. (1998). The validity and utility of selection methods in personnel psychology: Practical and theoretical implications of 85 years of research findings. Psychological Bulletin, 124(2), 262–274. https://doi.org/10.1037/0033-2909.124.2.262 ↩︎
Kirsch, I. S., Jungeblut, A., Jenkins, L., & Kolstad, A. (1993). Adult literacy in America: A first look at the results of the National Adult Literacy Survey. Washington DC: US Department of Education, National Center for Education Statistics. https://nces.ed.gov/pubs93/93275.pdf ↩︎
Calvin, C. M., Batty, G. D., Der, G., Brett, C. E., Taylor, A., Pattie, A., Čukić, I., & Deary, I. J. (2017). Childhood intelligence in relation to major causes of death in 68 year follow-up: prospective population study. BMJ (Clinical research ed.), 357, j2708. https://doi.org/10.1136/bmj.j2708 ↩︎
Arden, R., Luciano, M., Deary, I. J., Reynolds, C. A., Pedersen, N. L., Plassman, B. L., McGue, M., Christensen, K., & Visscher, P. M. (2016). The association between intelligence and lifespan is mostly genetic. International journal of epidemiology, 45(1), 178–185. https://doi.org/10.1093/ije/dyv112 ↩︎