
- The stability of g after childhood is high, surpassing that of any single psychological trait. IQ scores before the ages of 5-8 should be taken with a grain of salt. IQ reaches peak stability at age 20.
- IQ is elastic rather than plastic, because marked changes in the trajectory of a child’s mental development are typically followed by a return to the child's initial trajectory.
- Fluid reasoning gradually decreases over the adult life span, while crystallized abilities remain stable or even increase slightly until people are in the retirement years.
- For reaction time and the functioning of the working memory system, the degree of decrease accelerates after the mid-sixties.
- By late childhood, the genetic contribution to the stability of intelligence was 75 percent, whereas nonshared environment (in large part randomness) contributes 20 percent.
Like height, intelligence increases in the first years of life, remains at similar values for decades, and then declines at old age. Also like height, those who are smartest in early life tend to be the smartest in old age. Before examining declines, we will first detail the stability of intelligence throughout the lifespan.
Stability of g
The stability of intelligence is best understood at the level of the latent general intelligence factor (g) rather than observed IQ scores. Following classical test theory, this is because observed IQ scores can be represented as $X=g+s+e$, where $e$ is measurement error, which consists of random, unpredictable factors (e.g., fatigue, distraction) unrelated to the true trait being measured, and where $s$ consists of specific abilities (variance unique to subtests or a subset thereof), which is only moderately stable compared to the g factor. Thus, observed test scores may confound stability with measurement error, and hence tend to underestimate construct-level stability. Accordingly, the best longitudinal studies examine the latent variables themselves (using structural equation modeling), thereby eliminating measurement error. This works best when many (different) tests are administered, since error can then be better cancelled out when the common variance across many tests is extracted (g) through factor analysis.
One such study1 showed that 90% of the variance in g measured by four tests at ages 50, 55, and 60 was accounted for by g measured at age 18 by three different tests (stability coefficient .94-.95). At age 65, the stability dropped to .87 ($r^2=74$%; from age 18), which may be due to cognitive changes/decline from old age destabilizing individuals' lifelong intelligence. Additionally1, two computerized tests of working memory ($s$) were administered at age 65, showing a correlation of .61 with g measured at 18, and a .88 correlation with g at 65. Ultimately, across the lifespan, g behaves like a near-fixed trait, with WM being less stable (and probably other group factors as well). No other psychological trait is known to show such high stability across the life span.
Stability of IQ
A 2024 meta-analysis2 of longitudinal studies concludes that cognitive abilities (as measured by IQ tests) exhibit high rank-order stability, asymptotically peaking at around age 20 and remaining at this high level throughout adulthood and old age (see the last figure of this article). Mean stability estimate for age 20 and a test-retest interval of five years was $\rho$ = .77 for the observed correlations and $\rho$ = .86 for the disattenuated correlations (done through what's called correction for attenuation or reliability, which is just $\rho_{true} = \frac{r_{corr}}{\sqrt{r_{x} r_{y}}}$). Stability is much lower in young children. Before age 4, stability never exceeds .70, whereas in late adolescence, the stability no longer drops below this value for any test-retest interval2. Relatedly, later in this article, we discuss the Wilson effect, which denotes how, as children age, the proportion of IQ variance attributable to genetics increases (approaching 50-60% in adolescence), while the influence of shared environmental factors (like home life) decreases toward zero.
Using the stability values from the meta-analysis, the following table contains the expected stability ($r$) and respective average absolute change of IQ points across ages (p. 282)3: $$ \frac{2 \times 15_{\sigma} \sqrt{1-r^2} }{\sqrt{\pi}} \equiv 1.13 \times SE_{est} $$
| Age at first test | Stability to adulthood (r) | Average fluctuation (± IQ points) | Interpretation |
|---|---|---|---|
| Age 2–4 | 0.20–0.40 | ±15.5 to ±16.5 | Extremely unstable |
| Age 5–7 | 0.45–0.60 | ±13.5 to ±15 | Very unstable |
| Age 8–10 | 0.60–0.75 | ±11 to ±13.5 | Moderately unstable |
| Age 11–16 | 0.75–0.85 | ±9 to ±11 | High stability |
| Adulthood | 0.85–0.95 | ±5 to ±9 | Very high stability |
Just using the standard error of estimate, we get that there is approximately a 68% probability that IQ measured in adulthood will fall within a range of ±6.5 IQ points on a retest in adulthood ($SE_{est} = 15_{\sigma} \sqrt{1-.90_{r}^2}$), and a 95% probability of it falling within ±13 IQ points ($1.96 \times SE_{est}$). Due to reliability not being perfect, the observed IQ scores will invariably include some measurement error. Since most professional tests have a reliability (i.e., internal consistency) of over .90 (e.g., WAIS4's Cronbach's $\alpha = 0.98$), the standard error of measurement for one score is around ±4 IQ points ($15 \times \sqrt{1-0.9}$; 68% confidence interval). And when looking at the IQ differences between two tests like we're doing now, measurement error contributes around ±6 IQ points ($\sqrt{2} \times SEM$). So fluctuations to that degree can often be attributed to mere measurement error.
Much of the variability in mental growth rates from early childhood to maturity is genetically programmed, as shown by the fact that monozygotic twins (who share virtually 100% of their DNA) have nearly identical mental growth curves, with the same spurts and plateaus, while dizygotic twins (share 50%) show less similar growth curves, with spurts and plateaus occurring at different ages4.
Childhood IQ Scores
As the previous table suggests, below age 5 or 6 years, scores have little long-term predictive value for the individual child and should be treated only as indicators of the present level of performance. Even though the measures tend to be quite reliable and stable over short periods of time (table at p. 279)3, there is still the major factor of rapid developmental change during immaturity. Notably, the same kind of early-measurement limitation holds for height and weight and other developmental characteristics (table at p. 280)3. Infant mental tests in particular load heavily on perceptual-motor abilities and alertness (e.g., tests of habituation to stimuli), struggling to measure abstraction and reasoning.
Moreover, the correlation between scores on developmental scales that are based on activity and vocalization over the first thirty-six months of life and scores on adult intelligence tests is nearly zero5. But by ages 3-4, tests that involve vocabulary start showing the respective stability values on the previous table. Nevertheless, below age 5, one can better predict what a child’s IQ will be at age 15 from a knowledge of the average IQ of the parents than from any test score obtained on the child (because the former correlates ~.65 with the child's IQ measured after age 10; p. 281)3. Let's now walk through a hypothetical to illustrate the stability (or lack thereof) of high childhood IQs.
Assuming a stability coefficient of .50, a six-year-old child who scores 130 IQ has a predicted IQ of 115 ($y$) ±13 in adulthood, while one who scores 100 IQ has a predicted score of 100±13 ($0.5_r(30_{s1}) + 100_m$). This is due to a statistical phenomenon known as regression toward the mean. The probability that the 130-IQ-scoring child will score ≥120 IQ in adulthood is ~35%, while it's 65% for ≥110 ($x$), and 88% for ≥100, for instance:
$$ \frac{110_x-115_y}{13_{\sigma}} \approx -0.35_{zscore}; P(Z \geq -0.35) \approx 0.65 $$
While for a score of 130 in adulthood, assuming a stability coefficient of 0.86, the predicted score is 126±8 (with the test-retest interval potentially spanning decades), with a ~30% probability of scoring ≥130 IQ, 78% for ≥120, 98% for ≥110, and 99.9% for ≥100.
Spontaneous Changes in IQ
A thorough study4 analyzing spontaneous IQ changes was based on a representative sample of 794 children who were tested on the Wechsler Intelligence Scale for Children (WISC-R) at ages 7, 9, 11, and 13. The correlations of IQ at every age with every other age range from .74 to .84, so there was some reshuffling of rank order. The magnitude of changes, in IQ points, was rather normally distributed, with a mean near zero and a slight positive skew. The mean intraindividual standard deviation of IQ over all four test occasions was 3.35 points. At each testing interval, about 10 percent of the sample changed more than fifteen IQ points. For the vast majority of children, the fluctuations in IQ were small enough to be accounted for by measurement unreliability (SEM), but not for that 10 percent6. After analyzing thirty-seven family and child characteristics that have been theoretically or empirically related to IQ (such as motor development, perinatal problems, behavior problems, socioeconomic status, and the like), the authors concluded:
[We] cannot yet predict in advance whether or not a child’s IQ will change in response to any perturbing event, no matter how strong...the causes of marked IQ change may be unique events that occur in the lives of individual children; ‘the slings and arrows of outrageous fortune’. (p. 489-491)4
The IQ is described as “elastic” rather than “plastic,” because marked changes in the trajectory of a child’s mental development are typically followed by a return to the child's initial trajectory6. The finding that the reliable change in IQ that does take place is idiosyncratic and not associated with any identifiable environmental change is entirely consistent with the mental growth curves of MZ and DZ twins that suggest that spurts and plateaus are highly genetic4. Now we will move on to examine declines in intelligence across the lifespan.
Overview of Declines
The figure below7 shows the cognitive abilities measured in the Seattle Longitudinal Study7, along with the findings obtained in the cross-sectional and longitudinal comparisons for reasoning, spatial orientation, processing speed, numerical ability, verbal comprehension, and verbal memory (read Research Designs in our glossary). Cross-sectional results show a decline in reasoning, spatial orientation, and processing speed at age forty-six. Verbal memory begins to show decline at age thirty-nine. Numerical ability and verbal comprehension show a smoother developmental pattern. The average difference between the youngest and the oldest cohorts is equivalent to 2 standard deviations. Longitudinal results reveal a significant decline in processing speed and numerical ability at age sixty. Reasoning, spatial orientation, and verbal memory decline at age sixty-seven. Verbal comprehension shows a significant decline at age eighty-one.
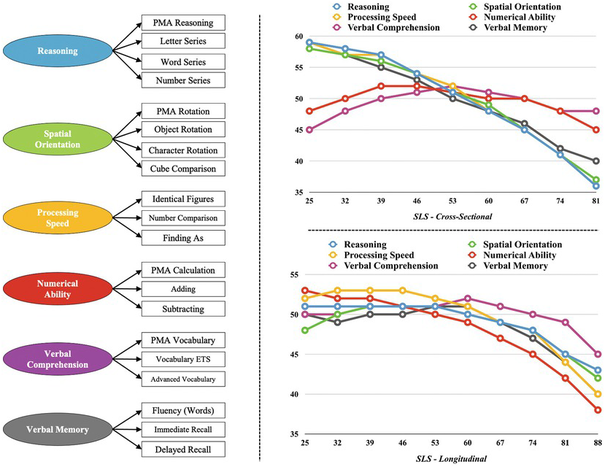
Combining cross-sectional and longitudinal designs, results showed that between twenty-five and eighty-eight years of age, (1) verbal comprehension declines 0.4 standard deviations, (2) reasoning and spatial orientation decline 0.8 standard deviations, (3) verbal memory declines 1.1 standard deviations, (4) processing speed declines 1.2 standard deviations, and (5) numerical ability declines 1.5 standard deviations. Therefore, the downward trend with increased age ranges between less than half a standard deviation for verbal comprehension to one and a half standard deviations for numerical ability.
Studies consistently show8 that Gc measures are more resistant to the aging process than measures of inductive reasoning (Gf). However, the studies are not consistent about precisely when the declines occur. In the SLS, some participants have dropped out over time, so there is a bias toward continued participation by people with higher initial cognitive abilities. This would result in an understatement of the age effect. Other studies, mostly cross-sectional ones, indicate8 declines starting in the mid-twenties for Gf and in the mid-thirties for Gc, but these studies tend to be confounded with cohort effects (largely the Flynn Effect, of which Gf is particularly sensitive), which would lead to an overestimation of the deleterious effects of aging.
Dedifferentiation Hypothesis
There is also debate about the extent to which the pervasiveness of the general intelligence factor (g) increases with advanced age. Technically, this is called the dedifferentiation hypothesis. The hypothesis predicts that the correlations between measures of different types of intelligence, such as verbal and visuospatial reasoning, will increase with age. Good arguments can be advanced for this hypothesis. Declines in intelligence are usually associated with declines in health. Injuries that influence the brain should have widespread deleterious effects on cognitive performance, although their differential impact may change dramatically for different premorbid intelligence levels.
Nonpathological reductions in the prefrontal cortex and other areas associated with the working memory system, which are typical of aging, are associated with lower fluid intelligence scores. Reduction in the capabilities of the working memory system should have a pervasive effect on almost all cognitive functions, which should lead to an increased influence of individual differences in g on performance. Nevertheless, the cognitive training literature fails to substantiate this presumption, because improvements in the working memory system fail to impact g (Protzko, 2017)9.
The evidence for the dedifferentiation hypothesis is mixed10. However, a comprehensive meta-analysis comes to a robust conclusion: a general factor of cognitive aging (g-aging) strengthens with advancing adult age (Tucker-Drob et al., 2019)11. Their key research question was whether individual differences in longitudinal changes are related across different cognitive abilities. These were the main conclusions from the meta-analysis:
- Longitudinal individual differences in changes of distinguishable intellectual abilities are strongly correlated among themselves. If inductive reasoning decreases, for example, the remaining abilities also tend to decrease. Changes are coupled.
- The amount of variance in cognitive ability levels explained by the g was 56 percent, closely similar to the amount of shared variance in rates of change, which was 60 percent.
- Cognitive decline may operate along a similar general dimension as does cognitive development in general.
These findings were interpreted within the conceptual framework proposed by Manuel Juan-Espinosa and colleagues (2002)12, which they call the in-differentiation hypothesis: the structure of life-span changes in cognitive abilities may be invariant in much the same way that the structure of changes in human anatomy are invariant. They proposed an anatomical metaphor:
As the human skeleton, there is a basic structure of intelligence that is present early in life. This basic structure does not change at all, although, like the human bones, the cognitive abilities grow up and decline at different periods of life (p. 406).
Information Processing
Information processes are hypothetical constructs used by cognitive theorists to describe how individuals apprehend, discriminate, select, and attend to specific aspects of the vast array of stimuli they receive. Working memory is an example of an information-processing concept, in the sense that it refers to an abstract ability to manipulate and/or hold pieces of information in the mind, without specifying what these pieces of information mean in the world.
Executive Function and Working Memory
The age-related breakdown in the working memory system is shown by decreased performance in short-term memory span tasks, greater susceptibility to interruption or distraction, and poorer control on dual tasks, such as simultaneously monitoring a stream of visual and auditory signals. These measures are, in general, those that are most closely related to psychometric measures of g and Gf. On one hand, the failure in working memory functioning appears to be general, rather than associated with a particular component of the working memory system. On the other hand, executive updating of information in short-term memory may play an important role.
Timothy Salthouse and colleagues (2003)13 asked if executive function may account for age-related intellectual decline. Is this decline attenuated when individual differences in executive functioning are controlled? To answer this question, data were obtained from 261 adults (age range eighteen to eighty-four) who completed a comprehensive battery of tests. Average performance scores across age bands for executive functioning (EF) measures are listed in the table below.
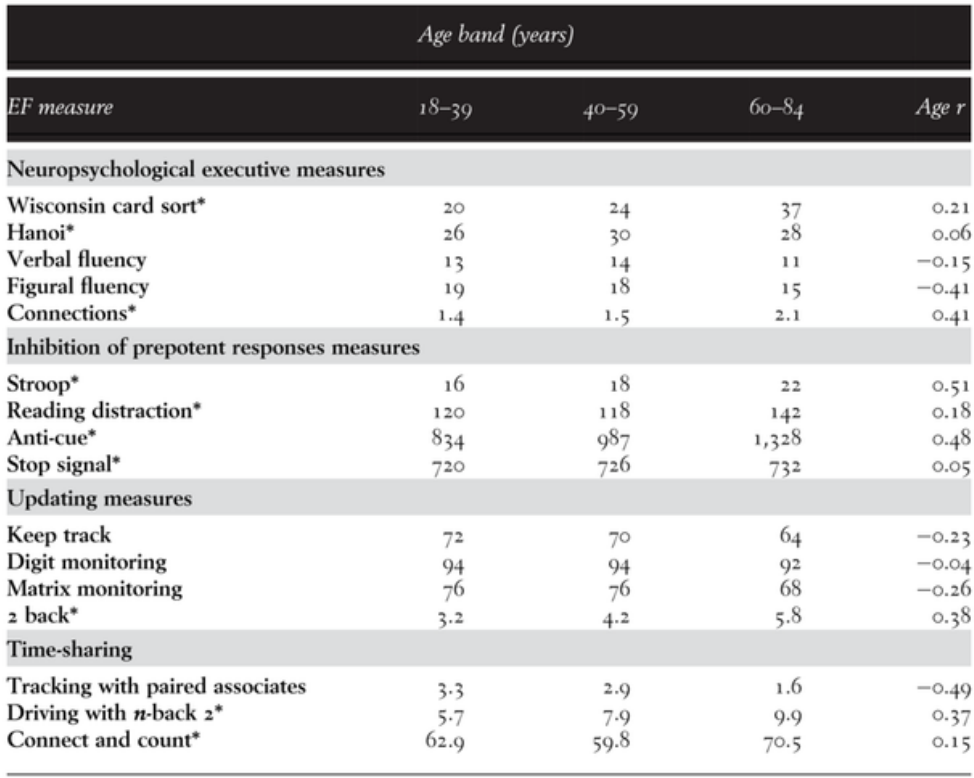
The findings from this comprehensive study led to four main conclusions:
- The executive function, updating, and time-sharing constructs showed very high correlations (r > 0.85) with fluid reasoning (Gf). Therefore, they might be tapping shared cognitive processes. The implication is that it does not make sense to control for executive functioning differences and see if this attenuates intellectual decline. Recall that diminished cognitive performances across age are coupled11.
- The specifics of executive functioning are much less important than usually assumed within the neuropsychological literature. Typical executive functioning measures tap cognitive processes shared by standardized measures of intelligence.
- The updating construct is more closely related to fluid reasoning (r = 0.93) than to memory (r = 0.72), speed (r = 0.79), and vocabulary (r = 0.30). This might support a distributed network involved in fluid intelligence and executive control in the brain.
- The executive function measures usually administered in neuropsychological research may not qualify as distinguishable psychological constructs beyond the classic standardized measures of intelligence: “one needs to be cautious in postulating the existence of a new construct without relevant empirical evidence that it is distinct from constructs that have already been identified” (Salthouse et al., 2003, p. 589)13.
Unfortunately, this last point is a recurrent problem in psychological research generally. Using a new label, such as executive functioning (EF), for designating a set of tasks does not prove that we are tapping different cognitive processes than those available measures, like intelligence tests, do not tap. Discriminant validity must be demonstrated before accepting the supposed new construct. At this construct level, the general factor of intelligence (g) and EF are almost identical with respect to the pattern of individual differences. This observation is corroborated in lesion mapping studies of intelligence and executive function (Barbey et al., 2012)14.
Mental Chronometry
Information processing occurs in real time, with each step in the process taking a certain amount of time. Time itself, therefore, is the natural scale of measurement for the study of information processes and the individual differences therein, hence the field of mental chronometry. Because time is measured on an absolute, or ratio, scale with international standard units, it has certain theoretical and scientific advantages over ordinary test scores. Test scores, on the other hand, are based on the number of items answered correctly on a particular test and, therefore, must be interpreted in relation to the corresponding performance in some defined “normative” population or reference group.
Many studies show cognitive slowing trends, but one of the most sound was conducted by Geoff Der and Ian Deary (2006)15. They surveyed a large sample of the UK population (N = 7,414), finding marked slowing of simple (SRT) and choice (CRT) reaction times with age. Choice reaction time, which requires more complex decisions, was more sensitive to aging. Reaction times slow, and results also become more variable with aging. These were their three main conclusions: (1) SRT fails to show any increase until age fifty (longer RT is a slower time); (2) CRT increases across the whole life span, and the values become more variable with age; and (3) the correlation between SRT and CRT was 0.67. The correlation between general intelligence (g) and SRT was r = −0.31, whereas the correlation between CRT and g was r = −0.49 (Der and Deary, 2003)16. The higher g is, the faster are the SRT and CRT values (i.e., greater processing speed, especially for CRT).

Intrasubject deviation (ISD) is measured as the standard deviation of an individual's RTs across trials. ISD can be thought of as essentially “inconsistency”. Interestingly, ISD is often more highly correlated with intelligence than the mean and median RT. ISD increasing with age has been viewed as a manifestation of "neural noise" or a decrease in the signal-to-noise ratio of neural transmissions.
The late Arthur Jensen (author of The g Factor: The Science of Mental Ability) described cognitive aging as a unitary "global slowing" of the central nervous system17. Jensen demonstrates that the mean RTs of older adults across various tasks can be predicted by multiplying the mean RTs of younger adults by a constant factor. This implies that aging does not typically affect specific, isolated cognitive processes, but rather represents a global reduction in the "cycle time" of the brain's information processing. In theory, this slowing has a cascade effect: as processing speed declines, the capacity of working memory is reduced because information decays before the necessary mental operations can be completed, which then impacts Gf, since fluid reasoning depends upon the working memory system.
In Jensen's view, the brain can be likened to a central processing unit (CPU) in a computer. The clock speed of that CPU determines how quickly it can execute instructions. In childhood, the hardware is "upgrading" as the wires become better insulated (myelination), allowing the system to run faster and handle more complex software. In aging, the system experiences a global reduction in clock speed, which is not caused by the software (knowledge) being deleted, but by the processor taking longer to execute every command, eventually reaching a point where complex programs "time out" because the hardware can no longer keep up with the demands. Jensen spells out the relationship between RT and intelligence (g) in his 2006 book titled Clocking the mind: Mental Chronometry and Individual Differences17, speculating it to reflect the speed and efficiency of information processing in the central nervous system.
Biology
Individual differences in mental test scores have a substantial genetic component, as indexed by the coefficient of heritability (in the broad sense), which is the proportion of the population variance in test scores attributable to all sources of genetic variability. On the other hand, environmental variance can be partitioned into two sources: (1) environmental influences that are shared among children reared in the same family but that differ between families, and (2) nonshared environmental influences that are specific to each child in the same family and therefore differ within families.
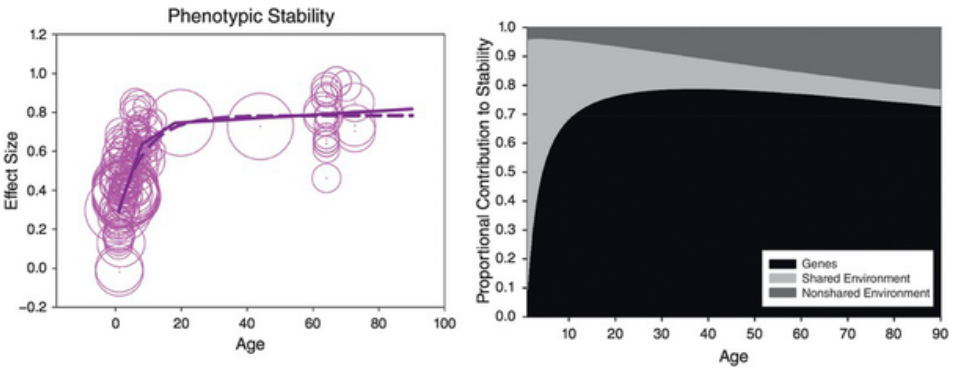
Elliot Tucker-Drob and Daniel Briley (2014)18 analyzed the issue of the genetic and nongenetic contributions to intelligence differences across the life span. They conducted a comprehensive meta-analysis of longitudinal twin and adoption studies. It included 150 combinations of time points and measures from fifteen longitudinal samples (4,548 MZT pairs, 7,777 DZT pairs, 34 MZ adopted pairs, 78 DZ adopted pairs, 141 adoptive sibling pairs, and 143 nonadoptive sibling pairs). The age range was from six months to seventy-seven years. Results showed that the stability of intelligence increases from effect sizes of 0.30 in early life to 0.6 at age ten and 0.7 at age sixteen, then reaches an asymptote (0.78) (left of figure). These were the main findings regarding the contribution of genetic and nongenetic factors to stability:
- While the contribution of genetic factors is null in early life, their relevance increases through child development and stabilizes at an asymptote effect size of 0.65 in adulthood. The increase in heritability of IQ with age is a finding known as the Wilson effect.
- Shared environment contributes moderately to stability in childhood (effect size 0.24), and this contribution fades to zero values by middle adulthood.
- Nonshared environment makes a very small contribution, although it increases somewhat with advanced age.
- By late childhood, the genetic contribution to the stability of intelligence was 75 percent, whereas nonshared environment contributes 20 percent.
The authors argue that these results support transactional models of cognitive development, underscoring gene–environment correlation and interaction. If shared environmental influences accumulate their influence on cognition over time through variables like social class or school quality, depending on children’s genotypes, then the estimates of the contribution of shared environment to stability should decrease with increased age, and this is what was found. Furthermore, the gene–environment correlation should lead to increases with age in the genetic contribution to stability, and this too was supported in the meta-analysis:
As children increasingly select and evoke differential levels of stimulation on the basis of their genotypes over time, genetic stability will increase. These considerations together indicate that estimates of genetic influence are likely to reflect environmentally mediated mechanisms” (p. 971)18.
The specific sources of much of the nonshared (within-family) environmental variance are still not entirely identified, but a large part of the specific environmental variance appears to be due to the additive effects of a large number of more or less random and largely physical events—developmental “noise”— with small, but variable positive and negative influences on the neurophysiological substrate of mental growth.
References
Rönnlund, M., Sundström, A., Nilsson, L.-G., & Nyberg, L. (2015). Interindividual differences in general cognitive ability from age 18 to age 65 years are extremely stable and strongly associated with working memory capacity. Intelligence, 53, 59–64. https://gwern.net/doc/iq/2015-ronnlund.pdf ↩︎ ↩︎
Breit, M., Scherrer, V., Tucker-Drob, E. M., & Preckel, F. (2024). The stability of cognitive abilities: A meta-analytic review of longitudinal studies. Psychological bulletin, 150(4), 399–439. https://doi.org/10.1037/bul0000425 ↩︎ ↩︎
Jensen, A. R. (1980). Bias in mental testing. Methuen. https://arthurjensen.net/wp-content/uploads/2020/04/Bias-in-Mental-Testing-Arthur-R.-Jensen.pdf ↩︎ ↩︎ ↩︎ ↩︎
Wilson R. S. (1983). The Louisville Twin Study: developmental synchronies in behavior. Child development, 54(2), 298–316. https://pubmed.ncbi.nlm.nih.gov/6683617/ ↩︎ ↩︎ ↩︎ ↩︎
Bayley, N. (1968). Behavioral correlates of mental growth: Birth to thirty-six years. American Psychologist, 23(1), 1–17. https://doi.org/10.1037/h0037690 ↩︎
Jensen, A. R. (1998). The g factor: The science of mental ability. Praeger. https://arthurjensen.net/wp-content/uploads/2020/04/The-g-factor-the-science-of-mental-ability-Arthur-R.-Jensen.pdf ↩︎ ↩︎
Schaie, K. W., & Willis, S. L. (2010). The Seattle Longitudinal Study of Adult Cognitive Development. ISSBD bulletin, 57(1), 24–29. https://pmc.ncbi.nlm.nih.gov/articles/PMC3607395/ ↩︎ ↩︎
McArdle, J. J., Ferrer-Caja, E., Hamagami, F., & Woodcock, R. W. (2002). Comparative longitudinal structural analyses of the growth and decline of multiple intellectual abilities over the life span. Developmental psychology, 38(1), 115–142. https://pubmed.ncbi.nlm.nih.gov/11806695/ ↩︎ ↩︎
Protzko J. (2017). Effects of cognitive training on the structure of intelligence. Psychonomic bulletin & review, 24(4), 1022–1031. https://pubmed.ncbi.nlm.nih.gov/27844294/ ↩︎
de Frias, C. M., Lövdén, M., Lindenberger, U., & Nilsson, L.-G. (2007). Revisiting the dedifferentiation hypothesis with longitudinal multi-cohort data. Intelligence, 35(4), 381–392. https://www.sciencedirect.com/science/article/abs/pii/S0160289606001188 ↩︎
Tucker-Drob E. M. (2019). Cognitive Aging and Dementia: A Life Span Perspective. Annual review of developmental psychology, 1, 177–196. https://pubmed.ncbi.nlm.nih.gov/34046638/ ↩︎ ↩︎
Juan-Espinosa, M., García, L. F., Escorial, S., & Rebollo, I. (2002). Age dedifferentiation hypothesis: Evidence from the WAIS-III. Intelligence, 30(5), 395–408. https://doi.org/10.1016/S0160-2896(02)00092-2 ↩︎
Salthouse, T. A., Atkinson, T. M., & Berish, D. E. 2003. Executive functioning as a potential mediator of age-related cognitive decline in normal adults. Journal of Experimental Psychology: General, 132, 566–594. https://pubmed.ncbi.nlm.nih.gov/14640849/ ↩︎ ↩︎
Barbey, A. K., Colom, R., Solomon, J., et al. 2012. An integrative architecture for general intelligence and executive function revealed by lesion mapping. Brain, 135, 1154–1164. https://pubmed.ncbi.nlm.nih.gov/22396393/ ↩︎
Der, G., & Deary, I. J. (2006). Age and sex differences in reaction time in adulthood: results from the United Kingdom Health and Lifestyle Survey. Psychology and aging, 21(1), 62–73. https://pubmed.ncbi.nlm.nih.gov/16594792/ ↩︎
Der, G., & Deary, I. J. (2003). IQ, reaction time and the differentiation hypothesis. Intelligence, 31(5), 491–503. https://gwern.net/doc/iq/2003-der.pdf ↩︎
Jensen, A. R. (2006). Clocking the mind: Mental chronometry and individual differences. Elsevier. https://arthurjensen.net/ ↩︎ ↩︎
Tucker-Drob, E. M., & Briley, D. A. (2014). Continuity of genetic and environmental influences on cognition across the life span: a meta-analysis of longitudinal twin and adoption studies. Psychological bulletin, 140(4), 949–979. https://pmc.ncbi.nlm.nih.gov/articles/PMC4069230/ ↩︎ ↩︎