
- This article evaluates the psychometric properties of the Gifted Entry Test (GET), a modernized adaptation of the Otis Gamma (Form EM), using a large online sample (N = 76,009).
- Results indicate excellent internal consistency (α ≈ .93) and strong measurement precision across a wide range of ability.
- The GET demonstrated a substantial loading on general intelligence (λ = .81) and strong convergent validity with the AGCT (r ≈ .74), increasing to approximately r ≈ .82 after correction for range restriction.
- Linear regression indicated strong normative alignment (β = 0.93, b₀ = 5.57, p < .001) with the AGCT, whose norms are derived from the general population.
- IRT analyses supported a 2PL model and indicated broad coverage of ability, though with reduced ceiling at the upper range.
- Despite limitations related to sample self-selection and ceiling effects, this article finds that the GET is a reliable, valid, and efficient measure of general intelligence suitable for large-scale online testing.
Introduction
Assessing general cognitive ability has long been central in educational and workplace selection contexts. Some of the most widely used intelligence tests in the early 20th century were developed by Arthur S. Otis, an American psychologist who pioneered the development of group-administered intelligence tests, making large-scale cognitive assessment more practical (Iqbal, 2024). First published in 1922, Otis’ tests focused on measuring general intelligence (g) through a variety of tasks covering verbal, quantitative, and fluid reasoning abilities. While the test was widely used in educational and selection contexts throughout the early to mid-twentieth century, it fell out of use over time, being replaced by more modern standardized cognitive and aptitude tests, such as the SAT and Wechsler scales.
The Gifted Entry Test (GET), hosted on CognitiveMetrics, is a restoration and modernization of the Otis Gamma, Form EM. This report assesses the reliability and validity of CognitiveMetrics’ large-scale administration (N = 76,009) of the GET/Otis Gamma in a contemporary population via Item Response Theory and Confirmatory Factor Analysis, while also confirming the accuracy of the updated norms.
Background
During World War I, a significant demand for mass psychological testing arose from the need to efficiently classify large numbers of military recruits. Otis contributed to the development of intelligence tests (such as the Army Alpha) as part of the U.S. Army’s World War I testing program under the direction of Robert Yerkes. Following the war, Otis developed a series of tests collectively known as the Otis Group Intelligence Scales, which evolved through multiple revisions and formats across the 20th century. These included instruments tailored for educational, industrial, and business settings, emphasizing quick administration and easy scoring. Among these developments were the Otis Quick Scoring Mental Ability Test series, which includes three tests (Alpha, Beta, Gamma). The Alpha is intended for grades 1-4, Beta for grades 4-9, and the Gamma for high school/college students. The Otis Gamma has six unique forms: AM, BM, C, D, EM, and FM (Otis, 1937).
Test Description
The Otis Gamma was a multiple-choice written test designed to measure general intelligence through a combination of verbal, logical, and numerical reasoning tasks. The EM Form, adapted by the GET, was a Spanish adaptation distributed in Latin America and used in applied settings such as personnel selection and educational evaluation. According to its technical specifications, the Otis Gamma EM: (a) Contains 80 items of progressive difficulty, (b) Has a 30-minute time limit, (c) Is intended for testees with high school education or above, (d) Can be taken individually or in group settings, and (e) Demonstrates strong internal consistency (reported split-half reliability ≈ .88) (Gerardo Pérez & Vite San Pedro, 2012).
The test samples multiple cognitive domains, including vocabulary, verbal analogies, sentence organization, logical reasoning, numerical series, and arithmetic problem solving. As such, it is best understood as a measure of general intelligence (g) rather than any specific, narrowly defined aptitude.
Adaptation for GET
The CognitiveMetrics GET adaptation of the Otis Gamma EM involved translating the Spanish form into English, with care taken to preserve the intended logic behind each item. Verbal knowledge and reasoning items were especially carefully reviewed, with the original semantic relationships and reasoning taken into account to ensure that the translated items were as faithful as possible to the originals.
To evaluate the psychometric integrity of the adapted instrument, item response theory (IRT) analyses were conducted, providing evidence that the translated items function appropriately in measuring general cognitive ability (g) within an English-speaking contemporary population. As the sample size increased, the test’s norms were updated multiple times using IRT to improve interpretability and allow for comparison with other IQ scales. One aim of this report is to evaluate the validity of these norms.
Methods
Descriptive Statistics
The sample consists of 76,009 individuals who completed the GET on CognitiveMetrics, an online cognitive testing platform. Most participants likely encountered the test through online communities, such as the r/cognitiveTesting and r/iqtest subreddits, suggesting a self-selected sample with a pre-existing interest in IQ and cognitive testing. This is unlikely to be randomly distributed; individuals are generally more interested in domains they expect to perform well in, resulting in a selection bias toward higher-ability participants.
For example, on the CORE FSIQ test, the number of subtests voluntarily completed (used here as a proxy for interest in IQ) was positively associated with IQ at r ≈ 0.25 (see Table 1). Testees who invested more time and effort to complete more subtests tended to have higher IQs.
| Subtests Taken | Mean IQ | SD | n |
|---|---|---|---|
| 1 | 113.2 | 13.65 | 12,297 |
| 2 | 115.7 | 11.98 | 4,234 |
| 3 | 117.0 | 12.21 | 1,923 |
| 4 | 118.5 | 12.12 | 1,173 |
| 5 | 119.1 | 11.60 | 967 |
| 6 | 120.3 | 11.72 | 761 |
| 7 | 119.7 | 12.00 | 641 |
| 8 | 119.5 | 12.05 | 612 |
| 9 | 121.4 | 11.77 | 544 |
| 10 | 122.9 | 12.08 | 586 |
| 11 | 123.1 | 11.99 | 590 |
| 12 | 122.7 | 11.05 | 469 |
| 13 | 123.6 | 11.18 | 337 |
| 14 | 122.3 | 12.32 | 110 |
| 15 | 122.3 | 10.94 | 118 |
| 16 | 124.0 | 10.25 | 130 |
| 17 | 127.8 | 10.45 | 144 |
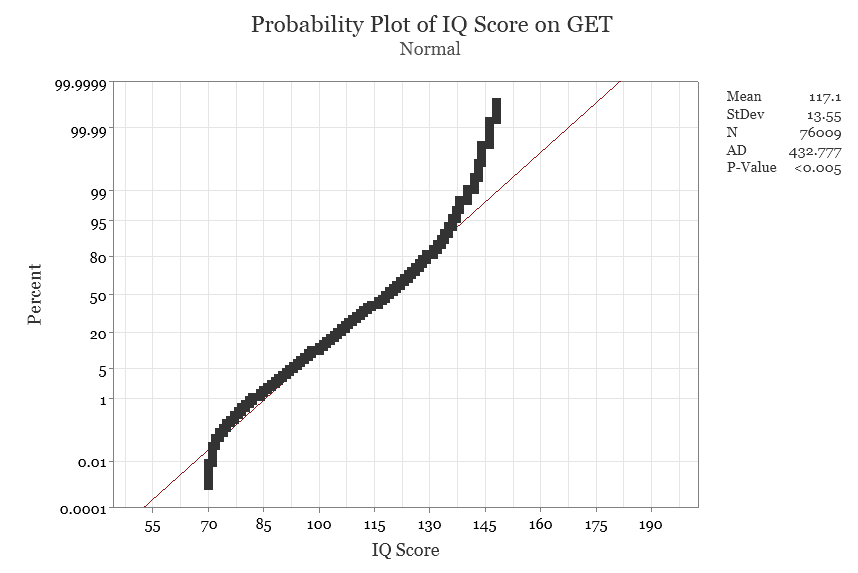
Similarly, as shown in Table 2, participants who took the GET on CognitiveMetrics constitute a high-ability sample, averaging 117.3 IQ, a bit more than one standard deviation above the mean. A smaller standard deviation of 13.55 (1.45 points below the population standard deviation of 15) is further evidence of self-selection.
| Statistic | Value |
|---|---|
| N | 76,909 |
| Mean | 117.1 |
| SE Mean | 0.0492 |
| StDev | 13.55 |
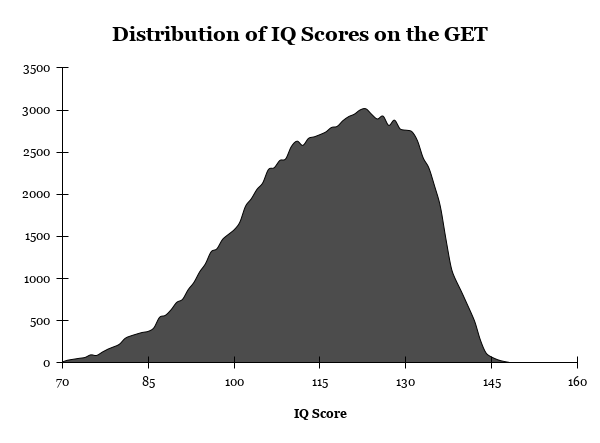
Visual inspection of the distribution plot in Figure 1 indicates a negative skew and evidence of a ceiling effect at higher IQ levels. The normal probability plot in Figure 2 shows scores clustering toward the upper end of the distribution as well, an expected pattern given the high-ability sample. The ceiling of the test is 148 IQ, meaning participants within this high ability sample who approach and exceed that value will be truncated. Accordingly, the observed non-normality should not be interpreted as a flaw of the test, but rather as a characteristic of the sampled population and testing context.
Geographic Representativeness
Due to the test being in English, this sample is restricted to participants residing in the following English-speaking, Anglospheric countries: the United States, Canada, the United Kingdom, Australia, and New Zealand.
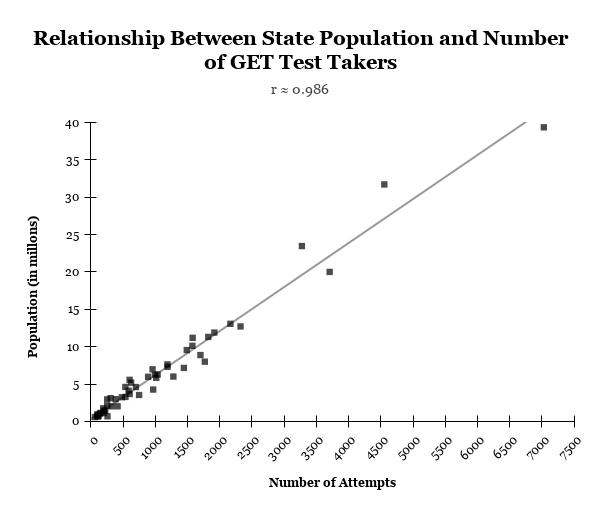
While self-selected, the GET sample still exhibited broad geographic diversity. To evaluate this, the number of participants from each of the five previously mentioned countries was compared to the national population size, revealing a near-perfect linear relationship (r ≈ .997), indicating that participation scaled proportionally with population across countries.
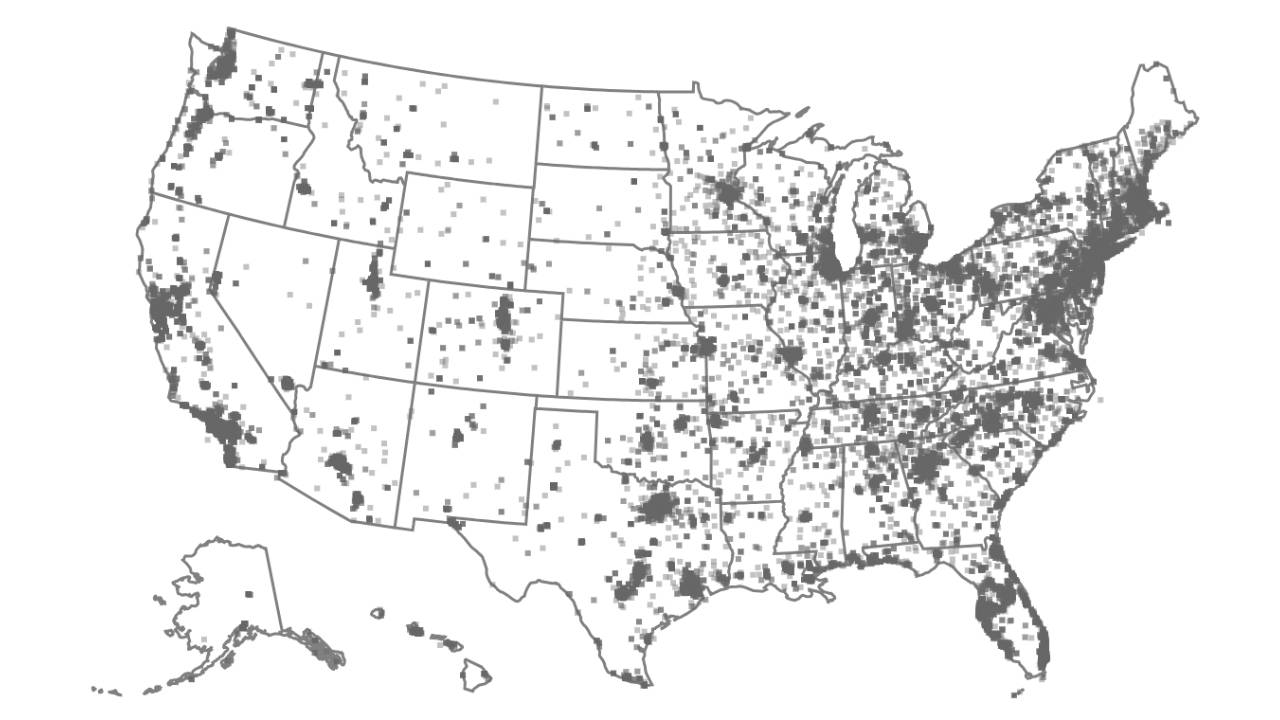
This was then extended to the state level within the United States (as observed in Figure 4), where a similarly strong relationship was observed (r ≈ .986). The consistency of this pattern across both the country and state levels suggests that the sample is broadly representative in its geographic distribution, with participation selected from the overall population rather than specific regions.
| Country | N |
|---|---|
| United States | 55,688 |
| United Kingdom | 7,940 |
| Canada | 7,751 |
| Australia | 3,910 |
| New Zealand | 720 |
Data Preparation
Out of the larger set of unsorted test attempts, a total of 76,009 were retained for analysis after cleaning the data. The data was first filtered to remove testees not from the aforementioned English-speaking countries. Next, all repeat attempts were removed, ensuring that only the first, unique attempt from each testee was kept. Finally, invalid test attempts (such as instances where participants did not engage meaningfully with the test or appeared to use external aid) were removed. The specific detection methodology is not described in detail in this report in order to preserve the integrity of the cheating-detection process. These steps guarantee that the final dataset contains valid, interpretable responses that measure our intended construct.
Reliability
Summary of Reliability Estimates
Internal consistency reliability was evaluated using classical test theory (CTT) and item response theory (IRT). As shown in Table 4, Cronbach’s alpha indicates excellent reliability (α = .93), agreed by an equivalent split-half estimate (λ₄ = .93). The average inter-item correlation was modest (r = .13), consistent with a broad measure of general intelligence, where diverse item content is expected, and excessively high inter-item correlations would suggest a narrower, more specific ability. From an IRT perspective, conditional reliability at the general population mean (IQ = 100) was similarly high (rₓₓ = .94), indicating strong measurement precision at typical ability levels. For comparison, the Otis Gamma manual reports a lower split-half reliability of .88 (Gerardo Pérez & Vite San Pedro, 2012), suggesting that the GET’s adaptation improved internal consistency relative to the historical version.
| Measure | Estimate |
|---|---|
| Cronbach’s α | 0.93 |
| Split-half | 0.93 |
| Average inter-item correlation | 0.13 |
| IRT rₓₓ (IQ = 100) | 0.94 |
| Split-half (Otis Gamma, reported 1954) | 0.88 |
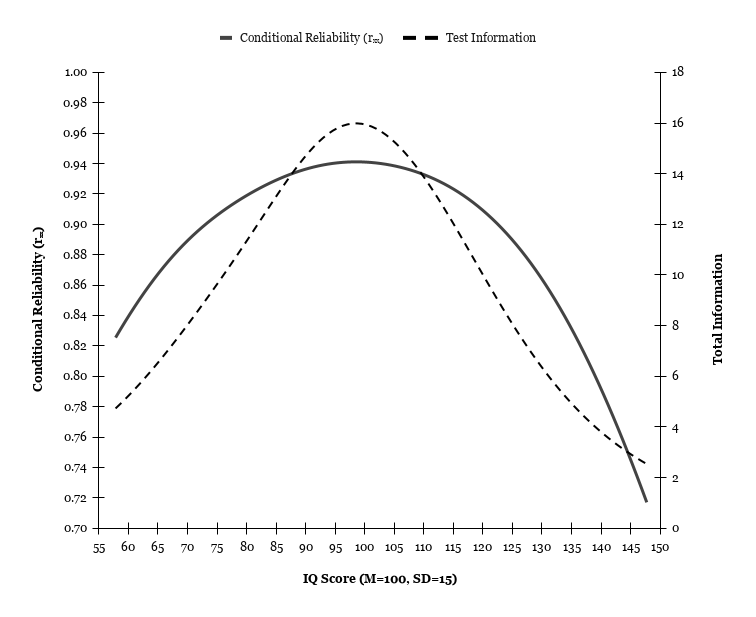
Conditional Reliability and Test Information Curve
Figure 5 displays the conditional reliability and test information curve under the 2PL model across the IQ scale. Regardless of the high-ability nature of the sample, both curves indicate that measurement precision is highest at the average levels of ability, with both test information and conditional reliability peaking at approximately 99 IQ.
Item Response Theory
Model Comparison
Model comparisons using likelihood ratio tests indicated that the 2PL model provided a significantly better fit than the 1PL model, Δχ²(80) = 49,917.95, p < .001, supporting inclusion of the discrimination parameter.
In contrast, both the 3PL model and 4PL model failed to converge. Any estimates yielded by these models were not stable for interpretation. The 2PL model was therefore retained as the primary model.
Model fit for the 2PL model was evaluated using the M2 statistic (as can be seen in Table 5) and associated fit indices. Although the M2 test was statistically significant, M2(3080) = 191,184.90, p < .001, this was expected given the huge sample size. The practical fit indices indicated excellent model fit with RMSEA = .0283, SRMSR = .045, CFI = .948, and TLI = .947. These values imply that the 2PL model is a strong representation of the data.
| Fit Index | Value |
|---|---|
| M2 | 191184.9 |
| df | 3080 |
| p | < .001 |
| RMSEA | 0.0283 |
| RMSEA 90% CI | [0.0282, 0.0285] |
| SRMSR | 0.045 |
| TLI | 0.947 |
| CFI | 0.948 |
Item Parameters
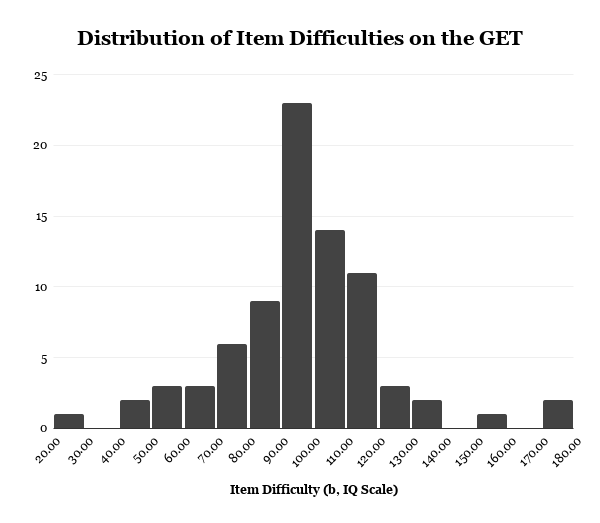
Appendix A presents the item parameter estimates and fit statistics for the 2PL model. Item discrimination parameters (a) varied substantially across items, ranging from very low values (e.g., Items 1-2, a ≈ 0.298, 0.331) to very high values (Items 22, a ≈ 1.802), indicating considerable variability in how well items differentiate between individuals across levels of the latent trait. A discrimination of roughly 0.5 to 2.0 is considered useful within 2PL models (Linacre, n.d.). With ~91% of items falling within this range, most items demonstrated moderate to high discrimination, suggesting that the test is generally effective at distinguishing between examinees of differing ability.
As shown in Figure 6, item difficulty parameters (b), expressed in IQ, were primarily concentrated around the average ability range, with most items covering approximately 70 to 120. Although the full range extended from very easy to very difficult items, very few items targeted the upper end (145+) of the ability continuum, justifying the current norms’ 148 IQ ceiling. Given the high ability of the online sample, this lack of highly difficult items likely contributed to the observed ceiling effects.
Item-Level Fit
Item fit was evaluated using item-level χ² statistics, RMSEA, and infit/outfit stats. As expected in very large samples, almost every item exhibited statistically significant χ² values (p < .001). This value is highly sensitive to sample size, where even minor deviations from the model can result in statistical significance rather than true misfit. Accordingly, greater emphasis was placed on fit indices, such as RMSEA and infit/outfit.
Inspection of RMSEA indicated that all items demonstrated excellent model fit, with values ranging from .003 to .043. These values fall well within commonly accepted thresholds for close fit (≤ .05), suggesting that the 2PL model accurately represents the item-level data.
Infit and outfit values near 1.0 indicate good fit, with values between 0.5 and 1.5 generally considered “productive for measurement” (Linacre, 2002). However, these fit indices are intended for Rasch models and should be interpreted more cautiously for 2PL models (as discrimination can vary). For our model, infit and outfit statistics were all within the suggested range, with infit ranging from 0.919 to 1.025 and outfit ranging from 0.732 to 1.105, suggesting strong item fit.
It is also important to consider potential violations of the local independence assumption. Because items were administered sequentially within a single testing session, dependencies may arise. Missing data were treated as missing not at random (MNAR). Trailing missing responses (assumed to reflect items not reached due to time limits) were coded as “not reached” and excluded from estimation, whereas non-trailing skipped items were treated as incorrect responses. This approach reflects the testing context and mitigates bias in parameter estimation.
g-Loading
To evaluate the construct validity of the GET, a confirmatory factor analysis (CFA) was conducted jointly with CORE, an FSIQ test with 17 subtests covering six CHC domains. A latent general intelligence factor (g) was defined by the CORE subtests, and the standardized GET score was included as an additional indicator. Model fit indices indicated good overall fit (CFI = .97, TLI = .96, RMSEA = .014, SRMR = .055), despite a significant chi-square test (which is expected given the sample size).
| Fit Index | Value |
|---|---|
| χ² (161) | 610.88*** |
| CFI | 0.970 |
| TLI | 0.965 |
| RMSEA | 0.014 |
| RMSEA (90% CI) | [0.013, 0.016] |
| SRMR | 0.055 |
The GET loaded strongly on the general factor (λ = .811), indicating that it shares substantial variance with g as measured by an established IQ test. Loadings greater than 0.80 are considered to be strong measures of intelligence, supporting the psychometric validity of the GET and highlighting the enduring validity of the Otis Gamma many decades later.
Normative Alignment and Convergent Validity
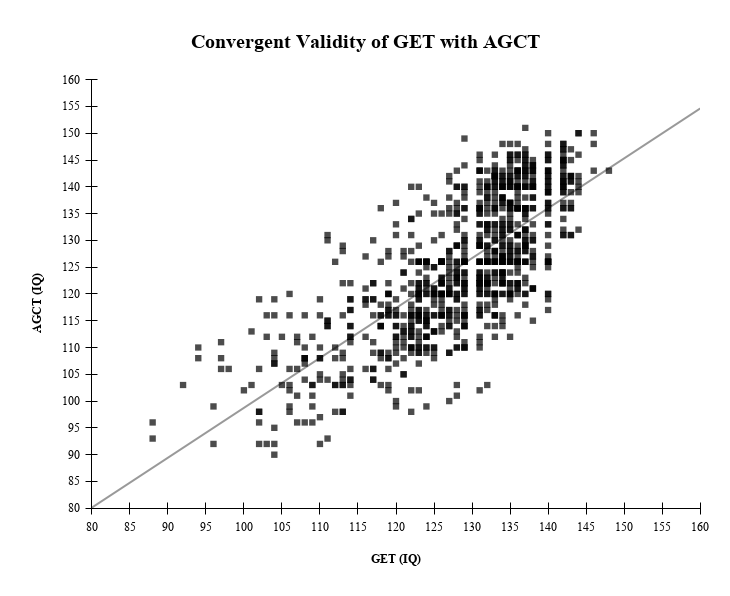
Convergent Validity with the AGCT
To assess the GET’s norms, scores were compared with scores from the AGCT on CognitiveMetrics. The number of participants who had valid attempts on both tests is significantly smaller than the full sample, with N = 905. The AGCT was selected because it provides a comparison to a test with norms derived from a general population sample, which is especially important for anchoring, given that the Otis Gamma’s contemporary norms are based on a high-ability, self-selected sample.
Convergent validity between the GET and the AGCT was evaluated using linear regression, as can be observed in Table 8. Results indicated a strong positive relationship, with GET scores significantly predicting AGCT scores (β = 0.93, p < .001). The model explained a substantial proportion of variance (R² = .55), corresponding to a correlation of approximately r ≈ .74. The regression slope was close to 1, suggesting strong agreement in scaling between the tests, with a small intercept. The standard error of estimate (≈ 8.6 IQ points) was consistent with typical differences observed between independent IQ tests. Overall, these findings provide strong evidence of convergent validity and support the comparability of GET scores with established IQ metrics.
It is also worth mentioning that the previously mentioned self-selection of interest in IQ selecting for IQ holds true within this sub-sample as well. Compared to the full sample, this sample is significantly smaller (1.19% of the original), the mean is higher (+11 points), and the standard deviation (-3.34 points) is restricted, mirroring the previously observed behavior that higher-ability individuals are more likely to have an interest in and engage further with cognitive testing.
| Variable | N | Mean | SD | Min | Max |
|---|---|---|---|---|---|
| GET | 905 | 128.07 | 10.21 | 88 | 148 |
| AGCT | 905 | 124.88 | 12.84 | 90 | 151 |
| Statistic | Value |
|---|---|
| β | 0.932 |
| Intercept (b0) | 5.57 |
| R² | 0.548 |
| r | 0.741 |
| SEE | 8.63 |
| p-value | < .001 |
Correcting for Range Restriction
Given the restricted ability range of the present sample, the observed correlation between the GET and AGCT (r ≈ .74) was corrected for range restriction using Thorndike’s Case II formula. Using the standard deviation of the overall sample (SD = 13.55) and the restricted subsample (SD = 10.21), the corrected correlation increased to r ≈ .79.
Notably, this correction is based on an already restricted sample (M ≈ 117.1, SD = 13.55), rather than a fully representative population. When extrapolated to a general population distribution (M = 100, SD = 15), the estimated corrected correlation rises further to r ≈ .82. This correlation is consistent with what is typically observed between well-established measures of general intelligence (typically between 0.8 and 0.9), confirming that the GET demonstrates strong convergent validity with g-loaded IQ tests.
Limitations
Several limitations should be considered when interpreting the results. Firstly, the sample is self-selected and drawn from an online population with an interest in cognitive testing. This introduces a selection bias toward individuals with above-average ability, as reflected in the higher mean IQ and reduced standard deviation of the sample. Interpretations of findings in this report should take the high-ability nature of the sample into account, especially when generalizing to the general population.
Relatedly, the restricted range of ability within the sample likely attenuated observed correlations between the GET and AGCT. Although statistical corrections for range restriction were applied, these corrections rely on assumptions (e.g., linearity and homoscedasticity) that may not be fully satisfied in practice. Corrected estimates should be taken as approximations rather than precise values.
A further limitation is regarding the administration format of the test. All items were presented sequentially within a single testing session, in alignment with how the original Otis Gamma was administered. However, this may violate the assumption of local independence underlying IRT models for some items by introducing dependencies between item responses. Nonetheless, both global and item-level model fit was strong, and parameter estimates were within expected and interpretable ranges, implying that any possible violations were likely minimal in practical impact.
Finally, the distribution of item difficulties was not uniform across abilities. In relation to the sample’s ability, the upper ceiling may be low, resulting in reduced measurement precision near the ceiling and a truncated distribution. Future revisions of the test would benefit from the addition of more difficult items to improve coverage and precision among higher-ability examinees.
Conclusion
This article provides comprehensive evidence supporting the psychometric validity of the GET as a modernized adaptation of the Otis Gamma (Form EM). Across multiple analytic approaches, the GET demonstrated excellent reliability, strong alignment with general intelligence (g), substantial convergence with established cognitive ability measures, and alignment with norms based on the general population. These findings indicate that the test is a quick way to accurately measure general intelligence for large-scale online testing.
While certain limitations were identified (most notably the self-selected, high-ability sample and reduced ceiling affecting the upper end of the ability distribution), these do not undermine the overall validity of the instrument. Further opportunities for improvement could be through the inclusion of more difficult items and further validation with more representative samples.
Overall, the GET’s strong psychometric properties, combined with its shorter duration and accessibility, support its use in research, large-scale assessment, and exploratory cognitive testing for online environments.
References
Iqbal, M. N. (2024). OTIS self-administering tests of mental ability. ResearchGate. https://www.researchgate.net/profile/Muhammad-Iqbal-657/publication/382334622_OTIS_Self-Administering_Tests_of_Mental_Ability/links/6698a4b94a172d2988aa2f6f/OTIS-Self-Administering-Tests-of-Mental-Ability.pdf
Gerardo Pérez, M. del C., & Vite San Pedro, S. (2012). Cuadernillo de prácticas 1: Pruebas de inteligencia: OTIS. Facultad de Psicología, Universidad Nacional Autónoma de México. https://www.psicologia.unam.mx/documentos/pdf/publicaciones/Cuadernillo_de_practicas_1.Pruebas_de_Inteligencia_OTIS_Gerardo_Perez_Vite_San_Pedro_TAD_6_y_7_sem.pdf
Linacre, J. M. (n.d.). Item discrimination or slope estimation. Winsteps. https://www.winsteps.com/winman/discriminationestimation.htm
Linacre, J. M. (2002). What do infit and outfit, mean-square and standardized mean? Rasch Measurement Transactions, 16(2), 878. http://www.rasch.org/rmt/rmt162f.htm
Otis, A. S. (1937). Leaflet with sheet, Otis quick-scoring mental ability tests: Manual of directions for Gamma test forms AM and BM. Smithsonian Institution. https://www.si.edu/object/leaflet-sheet-otis-quick-scoring-mental-ability-tests-manual-direction-gamma-test-forms-am-and-bm%3Anmah_692513
Appendix
| Item | a | b | b (IQ) | S-X² | RMSEA | Infit | Outfit |
|---|---|---|---|---|---|---|---|
| 1 | 0.298 | -6.849 | 24 | 52.71 | 0.009 | 1.000 | 0.998 |
| 2 | 0.331 | -4.517 | 56 | 32.00 | 0.006 | 0.999 | 0.994 |
| 3 | 1.329 | -1.644 | 95 | 169.92 | 0.016 | 0.994 | 0.891 |
| 4 | 0.797 | -5.027 | 49 | 24.80 | 0.005 | 1.020 | 0.971 |
| 5 | 1.032 | -3.531 | 69 | 48.16 | 0.008 | 1.025 | 0.928 |
| 6 | 0.823 | -2.807 | 79 | 61.08 | 0.009 | 1.005 | 0.959 |
| 7 | 0.656 | -5.316 | 45 | 15.09 | 0.003 | 1.012 | 0.988 |
| 8 | 0.842 | -4.566 | 55 | 28.52 | 0.006 | 1.022 | 0.955 |
| 9 | 0.905 | -2.475 | 84 | 73.49 | 0.010 | 1.002 | 0.960 |
| 10 | 0.951 | -3.436 | 71 | 59.48 | 0.009 | 1.016 | 0.972 |
| 11 | 0.807 | -2.087 | 89 | 83.93 | 0.011 | 0.992 | 0.979 |
| 12 | 0.839 | -2.634 | 81 | 62.69 | 0.009 | 1.003 | 0.962 |
| 13 | 0.783 | -4.157 | 61 | 48.10 | 0.008 | 1.011 | 1.000 |
| 14 | 1.204 | -1.790 | 93 | 110.14 | 0.013 | 0.993 | 0.927 |
| 15 | 0.915 | -4.541 | 56 | 32.17 | 0.006 | 1.018 | 1.003 |
| 16 | 0.605 | -2.862 | 78 | 102.91 | 0.012 | 0.995 | 0.994 |
| 17 | 0.747 | -1.840 | 92 | 93.95 | 0.012 | 0.993 | 0.966 |
| 18 | 0.829 | -3.185 | 74 | 38.69 | 0.007 | 1.005 | 0.979 |
| 19 | 1.008 | -1.629 | 95 | 160.75 | 0.016 | 0.992 | 0.930 |
| 20 | 1.429 | -2.626 | 81 | 101.50 | 0.012 | 1.014 | 0.945 |
| 21 | 1.382 | -1.619 | 95 | 139.76 | 0.015 | 0.990 | 0.901 |
| 22 | 1.802 | -3.336 | 72 | 128.27 | 0.014 | 0.919 | 0.732 |
| 23 | 0.654 | -0.044 | 116 | 333.06 | 0.023 | 0.980 | 0.979 |
| 24 | 1.181 | -1.086 | 102 | 323.85 | 0.023 | 0.979 | 0.911 |
| 25 | 0.762 | -1.447 | 97 | 133.96 | 0.014 | 0.983 | 0.983 |
| 26 | 1.084 | -1.612 | 95 | 96.28 | 0.012 | 0.988 | 0.937 |
| 27 | 0.540 | -1.026 | 103 | 103.14 | 0.013 | 0.988 | 0.988 |
| 28 | 1.214 | -2.020 | 90 | 85.26 | 0.011 | 0.989 | 0.971 |
| 29 | 0.592 | -0.974 | 104 | 116.60 | 0.013 | 0.988 | 0.979 |
| 30 | 0.513 | 4.289 | 175 | 426.23 | 0.026 | 0.996 | 1.012 |
| 31 | 1.678 | -1.672 | 94 | 169.86 | 0.016 | 0.970 | 0.997 |
| 32 | 0.478 | -3.182 | 74 | 427.76 | 0.026 | 0.993 | 1.003 |
| 33 | 1.070 | -1.425 | 98 | 113.38 | 0.013 | 0.983 | 0.939 |
| 34 | 0.705 | -1.374 | 98 | 176.15 | 0.017 | 0.993 | 0.965 |
| 35 | 1.010 | -2.481 | 83 | 731.62 | 0.034 | 0.978 | 1.105 |
| 36 | 0.706 | -1.140 | 102 | 141.55 | 0.015 | 0.990 | 0.969 |
| 37 | 1.049 | -1.733 | 94 | 282.36 | 0.021 | 0.977 | 0.999 |
| 38 | 0.782 | -1.726 | 94 | 243.86 | 0.020 | 0.999 | 0.947 |
| 39 | 1.070 | -1.783 | 93 | 96.26 | 0.012 | 0.985 | 0.964 |
| 40 | 0.857 | -0.276 | 113 | 594.93 | 0.031 | 0.978 | 0.956 |
| 41 | 1.725 | -1.689 | 94 | 122.62 | 0.014 | 0.981 | 0.902 |
| 42 | 0.816 | 0.859 | 129 | 610.80 | 0.031 | 0.965 | 0.985 |
| 43 | 1.535 | -1.242 | 100 | 173.16 | 0.016 | 0.965 | 0.936 |
| 44 | 0.942 | 1.389 | 136 | 1133.14 | 0.043 | 0.947 | 1.033 |
| 45 | 0.590 | 0.213 | 120 | 206.45 | 0.018 | 0.983 | 0.982 |
| 46 | 0.780 | -1.591 | 96 | 151.52 | 0.015 | 0.990 | 0.966 |
| 47 | 0.993 | -1.657 | 95 | 87.51 | 0.011 | 0.986 | 0.959 |
| 48 | 0.984 | -2.030 | 90 | 94.31 | 0.012 | 0.996 | 0.954 |
| 49 | 0.863 | -1.251 | 100 | 171.19 | 0.016 | 0.979 | 0.975 |
| 50 | 0.984 | -1.000 | 104 | 125.35 | 0.014 | 0.974 | 0.962 |
| 51 | 0.784 | -3.954 | 63 | 338.72 | 0.023 | 1.000 | 1.075 |
| 52 | 1.133 | -0.389 | 112 | 281.15 | 0.021 | 0.961 | 0.937 |
| 53 | 1.144 | -1.464 | 97 | 156.62 | 0.016 | 0.977 | 0.970 |
| 54 | 1.124 | -0.691 | 108 | 349.46 | 0.024 | 0.970 | 0.926 |
| 55 | 0.950 | -2.330 | 86 | 205.29 | 0.018 | 0.990 | 1.020 |
| 56 | 0.864 | 0.363 | 122 | 294.98 | 0.022 | 0.967 | 0.973 |
| 57 | 0.823 | -1.331 | 99 | 96.80 | 0.012 | 0.986 | 0.962 |
| 58 | 0.792 | 1.234 | 134 | 184.38 | 0.017 | 0.973 | 0.971 |
| 59 | 1.243 | 0.002 | 117 | 885.78 | 0.038 | 0.944 | 0.946 |
| 60 | 1.203 | -1.828 | 92 | 105.16 | 0.013 | 0.989 | 0.970 |
| 61 | 0.908 | -1.762 | 93 | 276.30 | 0.021 | 0.981 | 1.006 |
| 62 | 1.045 | -0.019 | 117 | 217.23 | 0.019 | 0.959 | 0.951 |
| 63 | 1.361 | -0.524 | 110 | 186.04 | 0.017 | 0.953 | 0.926 |
| 64 | 0.445 | 2.963 | 157 | 60.26 | 0.009 | 0.994 | 0.990 |
| 65 | 1.155 | -0.273 | 113 | 138.14 | 0.015 | 0.959 | 0.938 |
| 66 | 1.100 | -0.835 | 106 | 136.01 | 0.015 | 0.975 | 0.937 |
| 67 | 1.389 | -0.351 | 112 | 513.17 | 0.029 | 0.954 | 0.904 |
| 68 | 1.087 | -1.614 | 95 | 70.13 | 0.010 | 0.987 | 0.963 |
| 69 | 1.099 | -0.357 | 112 | 142.58 | 0.015 | 0.963 | 0.949 |
| 70 | 0.476 | 0.201 | 120 | 61.77 | 0.009 | 0.989 | 0.988 |
| 71 | 0.783 | -2.006 | 90 | 49.10 | 0.008 | 0.995 | 0.970 |
| 72 | 1.618 | -1.496 | 97 | 97.46 | 0.012 | 0.994 | 0.879 |
| 73 | 0.302 | -1.376 | 98 | 108.74 | 0.013 | 0.996 | 0.996 |
| 74 | 1.321 | -1.021 | 103 | 286.32 | 0.021 | 0.985 | 0.884 |
| 75 | 1.149 | -0.536 | 110 | 837.72 | 0.037 | 0.975 | 0.914 |
| 76 | 0.638 | -0.018 | 117 | 61.24 | 0.009 | 0.982 | 0.980 |
| 77 | 1.708 | -0.531 | 110 | 442.59 | 0.027 | 0.957 | 0.844 |
| 78 | 1.385 | -1.086 | 102 | 144.05 | 0.015 | 0.984 | 0.888 |
| 79 | 1.199 | 0.276 | 121 | 1077.50 | 0.042 | 0.941 | 0.979 |
| 80 | 0.367 | 3.981 | 171 | 463.57 | 0.027 | 0.993 | 1.005 |