1926 SAT
Introduction
The 1926 SAT marked the debut of the SAT, influenced by psychologist Carl Brigham, who previously worked on developing aptitude tests for the Army during World War I. This version of the SAT was seen as a psychological test, drawing inspiration from the Army Alpha intelligence tests. Additionally, Subtests 1, 2, 4, 5, and 7 were adapted from Brigham's 1925 Princeton Test. The first SAT was administered on June 23, 1926, to 4,829 boys and 3,211 girls at various colleges across the U.S. Designed to assess learning aptitude rather than academic knowledge, the SAT provided a standardized measure applicable to a diverse range of high school students for college admissions.
Construction
The test was reconstructed from scans uploaded by the College Board, some of which were partially cut off or of poor quality. Additionally, a new answer key had to be created, as none existed before this restoration. After developing a preliminary key, it underwent numerous revisions and discussions, with the final version being thoroughly reviewed and agreed upon to ensure accuracy (special thanks to Liam Milliken). The automation of the test was made to stay true to the format of the original 1926 SAT booklet as well.
Validity
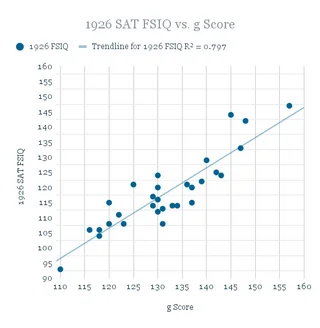
The First Annual Report of the Commission on Scholastic Aptitude Tests 1926 included the original norms from 1926. Using these norms, the 1926 SAT was administered to members of the community with known and validated scores. With 30 validated attempts, their FSIQ was compared to the g score resulting from compositing validated tests on the Big ‘g’ Estimator. Do not confuse correlations to g score with correlations to g.
At n=30, the g score correlated with the 1926 SAT FSIQ at r = 0.893 uncorrected.
Accepted tests include the SAT, GRE, AGCT, SB-V, SB-IV, WAIS-IV, WASI-II, WISC-V, WJ-III, CAIT, SMART, JCTI, PAT, Wonderlic, RAIT, Ravens 2, MAT and RAPM. The average IQ was 132.
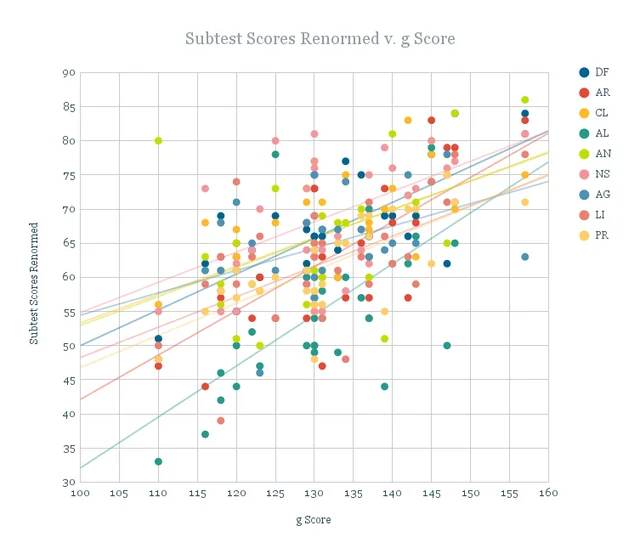
The following is the correlations between each subtest and g score:
| Subtest | r(X, g Score) |
|---|---|
| FSIQ | 0.8929 |
| KN | 0.8032 |
| FR | 0.6619 |
| QR | 0.6680 |
| VR | 0.8049 |
| DF | 0.7032 |
| AR | 0.6626 |
| CL | 0.6444 |
| AL | 0.6828 |
| AN | 0.4674 |
| NS | 0.5344 |
| AG | 0.4725 |
| LI | 0.5542 |
| PR | 0.7460 |
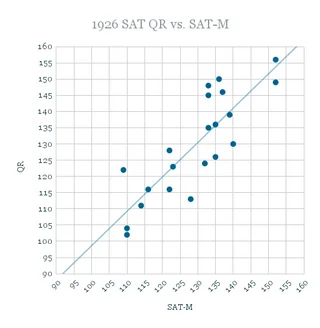
Furthermore, culture fair composites, such as the Quantitative Reasoning Index of the 1926 SAT showed strong alignment with the old SAT-M (r = 0.841).
Renorm
As expected, a test from nearly a century ago was deflated along its verbal subtests. However, since everyone is equally affected by the difference in verbal knowledge, it seems as though the g-loading of the test has been mostly preserved.


As demonstrated, the verbal subtests, as well as Verbal Reasoning and Knowledge are both deflated in relation to the other more “culture-fair” subtests, however the correlation to g score remains the same. In order to renorm the verbal deflation, we compared the verbal subtest’s norms to the subtest vs. SAT-V score and regressed to those scores. The following subtests were renormed: Definitions, Classification, Antonyms, Analogies, and Paragraph Reading.
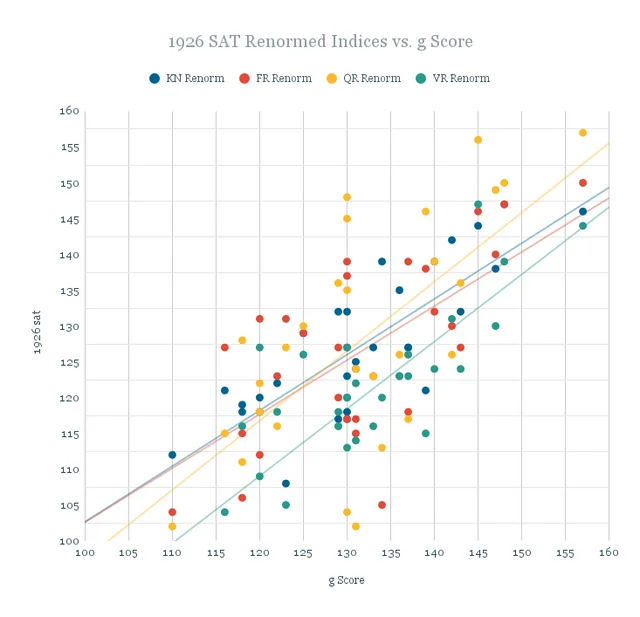
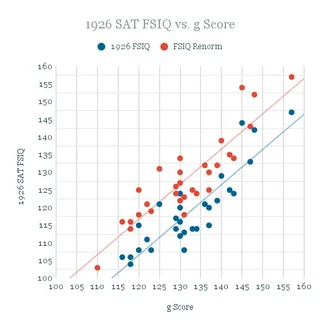
This adjustment brings it far more in line with people’s g scores, creating an almost bijective relationship as shown above. The following are the correlations after the renorm.
| Subtest | r(X, g Score) |
|---|---|
| FSIQ | 0.8946 |
| KN | 0.8119 |
| FR | 0.6619 |
| QR | 0.6680 |
| VR | 0.8093 |
| DF | 0.7136 |
| AR | 0.6643 |
| CL | 0.6538 |
| AL | 0.6756 |
| AN | 0.4568 |
| NS | 0.5351 |
| AG | 0.4916 |
| LI | 0.5560 |
| PR | 0.7461 |
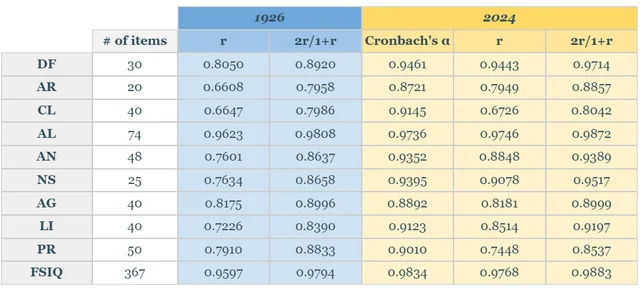
Reliability
The reliability was calculated by the College Board in 1926 by using the split-half reliability method and Spearman–Brown formula. It was calculated again with the modern sample.
Conclusion
This test correlates with g at around ~0.86 and has a reliability of 0.98, incredibly strong for an almost century old test. With more data, hopefully a more in-depth assessment of the test and its validity can be made. Enjoy.
Reference
Brigham, Carl. First Annual Report of the Commission on Scholastic Aptitude Tests. 1926, Princeton University. Accessible at https://pdfhost.io/v/Cdac5m7bx\_SAT1926Report.