Misconceptions About IQ
This page is still a work in progress and most sections are incomplete.
This section aims to dispell popular myths regarding psychometrics and IQ.
General
"IQ tests only measure how good you are at taking IQ tests."
The claim that "IQ tests only measure how good you are at taking IQ tests" collapses when you put it up against a century's worth of predictive-validity research. Scores on IQ tests generalise far beyond just "IQ tests", anticipating how easily people learn, solve novel problems, and translate knowledge into real-world results
Meta‑analytic work spanning more than 82,000 students demonstrates that measures of general cognitive ability (g) are among the single strongest predictors of classroom achievement- outperforming emotional intelligence, socioeconomic background, and conscientiousness. Jensen points out in The g Factor:
The correlation of IQ with grades and achievement test scores is highest (.60 to .70) in elementary school, which includes virtually the entire child population and hence the full range of mental ability. At each more advanced educational level, more and more pupils from the lower end of the IQ distribution drop out, thereby restricting the range of IQs. The average validity coefficients decrease accordingly: high school (.50 to .60), college (.40 to .50), graduate school (.30 to .40).
Arthur Jensen, The g Factor (p. 278)1
g's relationship to scholastic performance is consistently positive and sizeable, but the strength of that relationship diminishes as you move up the educational ladder. This is not due to any change in the psychology of intellgence, but rather an expected statistical phenomenon known as "range restriction" (lower-IQ students exit the pipeline earlier, so the remaining pool becomes a specific, restricted sample, and correlations naturally shrink when variance on one variable is artifically limited). However, even the attenuated graduate-level correlations (.30-.40) are, by the standards of educational psychology, impressively high.
This is supported a review of 70 independent samples by Kuncel, Hezlett, and Ones (2004), who report a corrected true‑score correlation of r = .39 between scores on the g‑loaded Miller Analogies IQ Test and cumulative graduate GPA, with an even higher r = .41 for first‑year GPA; g correlations climbed to r = .58 for comprehensive exam scores and remained substantial for faculty ratings (r = .37) and supervisor‑rated job performance (r = .41). These magnitudes comfortably sit in the mid‑.30s to mid‑.40s (and higher) range that characterize g's predictive power across educational settings2. As summarized by Professor Russel Warne in In the Know, higher IQ students "learn more rapidly, learn more efficiently, organize and generalize information more spontaneously, and make fewer errors than their average or below-average classmates" (Warne, 170).
The same pattern appears in employment. As shown in Figure 1 below, "scores on cognitive ability tests are strongly related to success in occupational training in both civilian and military jobs, with meta-analytic estimates ranging from the high .30s to 70s (Ones et al., 2005)"3. Across every occupation, results from IQ tests are a reliable predictor of a range of outcomes, from job effectiveness and leadership success to judgments of creativity.
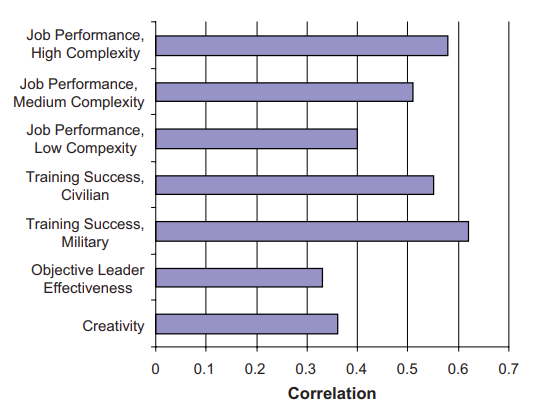
Fig. 1. Correlations between cognitive ability and measures of work performance3
A landmark meta-analysis showed that, general mental ability correlates about r ≈ .58 with performance in the most complex jobs and r ≈ .23-.51 in less complex roles. An updated review of 100 years of selection research puts the mean validity of g at roughly .50 across all jobs4.
A longitudinal meta-analysis that followed more than 80,000 people from childhood or adolescence into established adulthood found that pre-19 IQ scores predict occupational status at r ≈ .45 and income at r ≈ .23 when outcomes are measured after age 29. Importantly, the same review confirmed the r ≈ .51 IQ to job performance correlation reported by Schmidt & Hunter, showing how early cognitive ability foreshadows how well people work. These translate into large economic gains for organisations because smarter employees master training faster, make fewer errors, and sustain higher productivity.5
Beyond school and work, higher IQ in youth forecasts later income, occupational prestige and employment stability. Strenze's (2007) longitudinal meta-analysis6 found that childhood intelligence predicts educational attainment (r ≈ .56), occupational status (r ≈ .51) and income (r ≈ .40) decades later, even after family socioeconomic status is controlled.
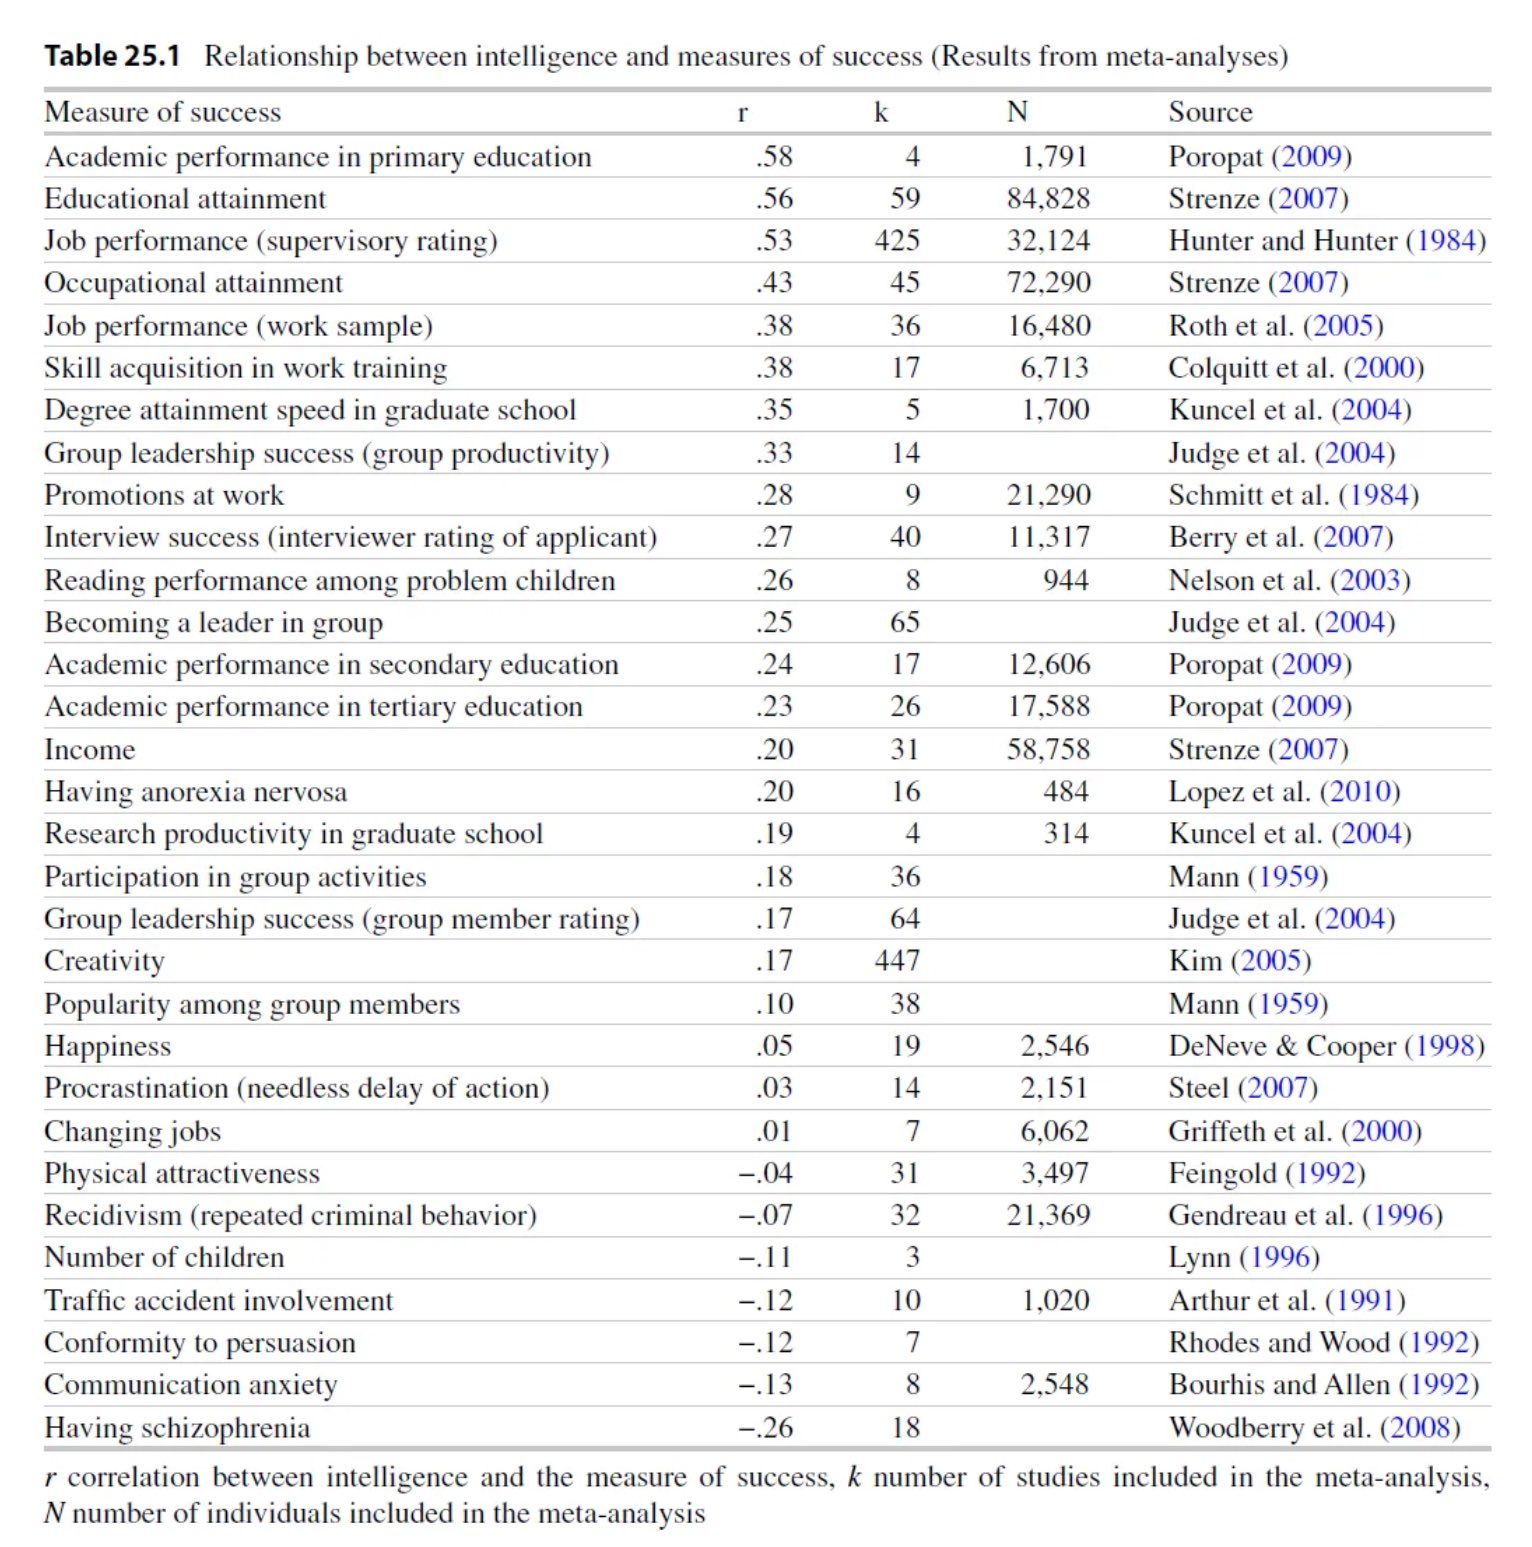
Fig. 2. Relationship between intelligence and measures of success (Strenze, 15)6
A century of evidence shows that IQ tests do far more than predict success on other IQ tests. Meta-analyses covering tens of thousands of participants converge on the same story: the general cognitive factor g is one of the single best predictors of upper and lower level education, employment, life outcomes, and much, much more.
"All online IQ tests are fake and only an in-person administration is accurate."
No- the frequent claim that one may account in the average reddit comment section that "all online IQ tests are fake" and "only a psychologist proctored IQ test is real" is a oversimplification and misattributes the reason to the mode of administration (online vs. psychologist proctored). While most online tests that dominate search results and social media feeds are unvalidated and nothing more than a quick cash grab, not all of them are. These commercially driven tests are usually made without any knowledge on psychometrics or its standards, often throwing together random questions and returning random scores at the end, and this has severely damaged public confidence and understanding in psychometrics. This is why these tests don't publish data on reliability, validity, or normative sampling. However, this doesn't mean all online IQ tests are inaccurate and you can find many validated online tests in this community's resources list.
However, one misconception that has arose is that the online format is inherently less accurate than an in-person format. Validity depends on the construction of the test and the conditions of administration and recent research proves this. A 2024 randomized repeated measures study showed that adults who completed the Wechsler Adult Intelligence Scale–IV (WAIS-IV) through an online administration earned practically the same scores as an in-person administration. The mean differences on 13 of 15 subtests were smaller than the test's own standard error and FSIQ correlations exceeded .907. Furthermore, a meta-analysis published in 2025 pooled dozens of remote neuropsychology studies and found that, across verbal and non-verbal tasks, remote and in-person administrations differed by well under one tenth of a standard deviation, below thresholds that matter in clinical and educational decisions8. This has also been found for children on the WISC-V9 as well as clinical populations being administered online. Even self administered online tests have met the bar, for example, the ICAR-16 shows a convergent validity of r ≈ .80 with the in-person WAIS-IV, and the longer ICAR-60 reaches the high .80s to low .90s10.
So the final answer is pretty simple: bad online IQ tests are bad because they ignore psychometric standards, not because they happen to be online. Well designed digital tests replicate in-person accuracy, with mode of delivery contributing little more than trivial measurement error. Before trusting any IQ score, whether it is in-person or online, try to find evidence that the test is reliable, properly normed, and validated for the purpose you have in mind. If that evidence is there, the mode of administration makes no difference; if it is absent, the test was never trustworthy to begin with.
"There is more than one intelligence but IQ tests only measure one narrow definition of it."
Howard Gardner's Multiple-Intelligences (MI) framework is a common concept taught in education, yet whenever researchers administer tasks meant to isolate his eight (now nine) "independent" intelligences alongside standard reasoning, memory, spatial, and speed items, factor analysis keeps extracting a single general factor (g) of intelligence that all tasks load on (replicated across dozens of batteries and cultures).
Strengths and weaknesses certainly exist, but they cluster around that shared intelligence rather than in independant, separate cognitive abilities. Moreover, g (represented by an FSIQ score) predicts classroom learning, job performance, income, health, and even longevity better than any MI-based measure, while MI scores add little when g and personality are controlled11. When a sample of 436 adults were administered three non-overlapping test batteries (the WAIS, the Comprehensive Ability Battery, and the Hawaii Battery with Raven), it was found that the g factors extracted from each were practically identical (r = .99–1.00)12.
The same general factor re-emerges no matter how you sample cognitive tasks or compute the statistics. Contrary to the misconception that an FSIQ score is "one dimensional", modern IQ batteries already test language, spatial, numerical, working-memory, and processing-speed tasks. Their accuracy comes precisely from aggregating what is common across many kinds of items and this is why it is the most validated construct in differential psychology.
"IQ doesn't measure anything meaningful beyond 120 IQ and is only good for telling apart intellectual disability."
A common claim is that above some arbiritrary threshold, usually 120 IQ, extra points have such little practical effect that scores become meaningless to compare. However, the research directly contradicts this. Meta-analytic work pooling 70 independent datasets showed that the correlation between psychometric intelligence and creative achievement is found no statistically significant difference above the 120 threshold vs. below it13. Break point studies that tried to locate a ceiling also find either no ceiling at all or only for low-level "creative potential", while genuine accomplishments keep rising with g. This means there is no threshold where transforming ideas into recognised work doesn't continue to benefit from more mental ability across the entire IQ range14.
The Study of Mathematically Precocious Youth (SMPY) has tracked thousands of adolescents who scored in the top 1% (and a subsample in the top 0.01%) since the early 1970s. The top quartile of this (already elite) group went on, by their early 30s, to earn patents at roughly twice the rate of equally "gifted" peers one quartile lower (≈7.5% vs 3.8%), complete STEM Ph.D.'s nearly four times as often (≈9.8% vs 2.5%); and secure tenure track jobs at top 50 research universities more than eight times as often (≈3.2% vs 0.4%)15. These widening gaps, captured 20 years after the initial testing, shows there is no loss in predictive power beyond some threshold of IQ and more can predict rarer and more prestigious accomplishments later on.
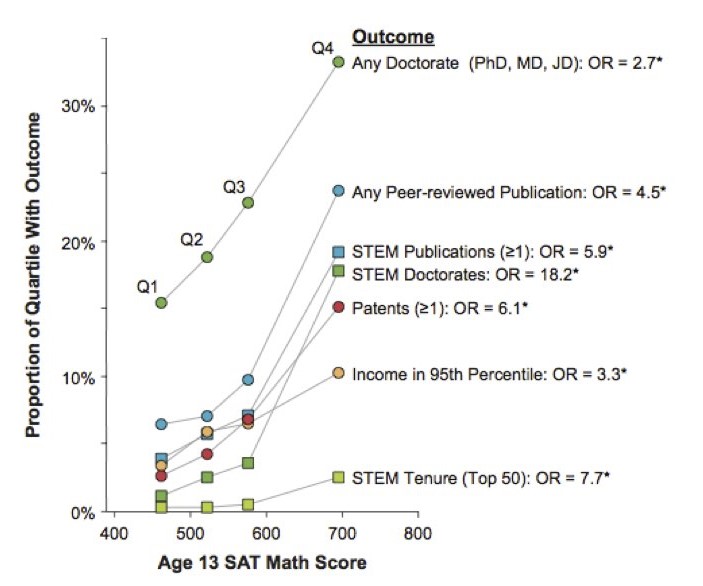
Fig. 1. Accomplishments across individual differences within the top 1% of mathematical-reasoning ability 25+ years after identification at age 13. Participants from Study of Mathematically Precocious Youth (SMPY) Cohorts 1, 2, and 3 (N = 2 385) are separated into quartiles based on their age-13 SAT-M score. The quartiles are plotted along the x-axis by their mean SAT-M score. The cutoff for a score in the top 1% of cognitive ability was 390, and the maximum possible score was 800. Odds ratios (OR) comparing the odds of each outcome in the top (Q4) and bottom (Q1) SAT-M quartiles are displayed at the end of every respective criterion line. An asterisk indicates that the odds of the outcome in Q4 was significantly greater than in Q1. STEM = science, technology, engineering, or mathematics. STEM Tenure (Top 50) = tenure in a STEM field at a U.S. university ranked in the top 50 by U.S. News & World Report's "America's Best Colleges 2007." Adapted in part from Park, Lubinski, and Benbow (2007, 2008).
Among the 1,528 mostly-Californian children whose childhood Stanford-Binet IQ averaged around 150 (all above 135) in Lewis Terman's longitudinal study, the upper half of the IQ distribution went on to earn more Ph.D.'s, author more books and scientific papers, and receive higher expert "eminence" ratings than the lower half, even though every participant was well above the "120 IQ" threshold16.
There are a few theorized reasons why this myth persists, the first being range restriction. When universities and programs select people only on the upper end of the scale, range restriction artifically shrinks the remaining variance (due to only analyzing a "restricted range" of people). This makes differences seem less smaller than they really are. Another less common one is a misunderstanding of Spearman's Law of Diminishing Returns (SLODR). While SLODR states that the g-loading of a test decreases the higher ability you go, this doesn't mean higher ability scores are meaningless, nor does it mean this is a universal effect that extends equally across every test. Furthermore, when trying to track success at the top level (through patenting, grants, Nobel-level discoveries, etc.), you need very large samples and decades of follow up before you can measure any predictive power, which is often very hard to do. However, when these hurdles are cleared, the evidence consistently shows that IQ differences into the high range are still meaningful.
"Hard work, creativity, or emotional intelligence matter more than IQ."
It is understandable to believe that other factors are more important than IQ, such as hard work, creativity or emotional intelligence, as that is what Western culture has instilled, however, the evidence from large scale meta-analyses shows the opposite. general intelligence "g", measured by IQ, is the most powerful predictor we have for learning speed, job competence, earnings and even many forms of creativity, ahead of other measureable personality traits.
A 240 sample psychometric meta-analysis covering 105,185 students found a population correlation of p ≈ .54 between IQ and school grades, dwarfing every non-cognitive trait examined in the same literature17. On the other hand, conscientiousness shows a weighted correlation of only r ≈ .22 with GPA in Poropat's 70,000-participant review18. g explains over four times as much variance in academic performance than diligence and hard work does.
Schmidt and Hunter's meta-analysis of 85 years of personnel selection research reports a corrected validity coefficient of p = .51 for General Mental Ability (GMA) in predicting overall job performance for medium complexity roles (which account for roughly 62% of U.S. jobs)19. No other single predictor approaches this level of accuracy. Adding personality measures (such as conscientiousness20) only increases validity by mere hundredths, showing that while diligence helps, the most important trait is g.
In 2022, Zisman & Ganzach re-analysed six large longitudinal surveys (NLSY79/97, WLS, MIDUS, ADD-Health, and the German PIAAC). Across them, intelligence explained 23% of the variance in educational attainment versus 5% for the entire Big-Five personality profile; for GPA the gap was 23% vs. 2%, and even for wages IQ still doubled personality (8% vs. 4%). The authors conclude that the "personality beats IQ" narrative is "greatly exaggerated"21.
Creativity is not an exception either. Large meta-analyses show that general intelligence contributes more to tangible success. IQ correlates about .54 with school grades, in contrast, divergent-thinking (DT) tests top out at ~.22 with academic achievement22. Furthermore, divergent-thinking tests correlated r = 0.216 with creative achievment, while IQ tests correlated r = 0.167 with creative achievment23. While DT does a little better than IQ, both effects are small (less than 5% shared variance). Generating ideas helps, but psychometric g remains the stronger, more versatile asset.
The problem that arises with emotional intelligence (EQ) is the vague and varying definitions that arise when speaking to different experts on the topic. This is compounded when looking at various studies attempting to guage the predictive validity of EQ, which are often poorly designed, not formally published, and not peer-reviewed. Studies that make it past these barriers don't paint a good picture for EQ.
The published literature is much less favorable to emotional intelligence and shows that the tests of emotional intelligence are weaker predictors of academic performance than IQ (Siu & Reiter, 2009). For example, high school rank (a measure of academic success) correlates r = .23 and job performance correlates r = .28 with emotional intelligence (Mayer et al., 2008, p. 337).
Russel Warne (2020), In The Know: Debunking 35 Myths about Human Intelligence (p. 231)
Contrast this with IQ, which is shown to correlated 0.50 to 0.70 with academic achievement and 0.30 to 0.50 with job performance.
Why does IQ consistently correlate more to success? Higher g reduces the time and effort it takes to master new skills, leaving more for strategy, self-regulation and even creative output. Hard work, social skill and disciplined habits absolutely matter, but they are multiplicative, not substitutive, factors. When two people exert equal effort, the one with greater cognitive efficiency learns more per hour, performs better per source of feedback and compounds those gains over time. To be clear, effort, creativity and emotional intelligence are not irrelevant or useless, however, it does not substitute for general intelligence. IQ is not everything, but across education, work, income and innovation it remains the most robust predictor we have, above hard work, creativity, and emotional intelligence.
"I know successful low IQ people and unsuccessful high IQ people, so IQ must be fake."
Using a couple of personal counter-examples to try to disprove IQ reveals a basic misunderstanding of how probability works. Everything in life, from blood pressure readings to market forecasts, is a probabilistic signal, not a deterministic one, and IQ is no different.
Let's take a look at one specific example:
Decades of data place the correlation of IQ and primary school grades at around ~0.606. Under the usual normal assumption, we can use Greiner's equality24 to estimate the probability that two randomly chosen pairs are concordant with the claim higher IQ -> better primary school grades.
Using τ, we can then calculate probability of concordance with:
This means that the higher IQ primary school student will have better grades than the lower IQ one roughly 70% of the time. Pointing to the other 30% of cases and trying to draw a reverse conclusion is just inaccurate. Expecting any correlation to deliver deterministic predictions is not skepticism, it is innumeracy.
"The SAT measures academic achievement and can be practiced for, therefore SAT scores do not represent intelligence."
While there is some truth to this statement, some distinctions and clarifications have to be made. This statement is only true for the SAT after 1994, where the College Board deliberately redesigned the test to mirror high school coursework. "Thanks to an unprecedented assault from the head of the University of California system, the College Board (the nonprofit organization that owns the SAT) has begun its biggest overhaul ever of the test"25. In early 1994, the verbal section dropped antonyms, doubled the share of passage-based reading, and the math section began allowing calculators and open-ended responses. These changes were repeated in subsequent updates to the test, diluting its saturation with the general intelligence factor (g). Due to these changes, the modern SAT moved from an aptitude test to a scholastic achievement test which can definitely be practiced for. However, this wiki will be specifically referring to the SAT forms before 1994, which have been found to be psychometrically equivalent to a Full Scale IQ test.
Directly admitted by the College Board president, Gaston Caperton, "in its original form [the SAT] was an IQ test."25 In 2004, Frey & Detterman, using a National Longitudinal Survey of Youth subsample who had taken the old SAT, found the composite score correlated r = 0.82 with g extracted from the ten subtest ASVAB, and r = 0.72 (range-restricted) with Raven's Advanced Progressive Matrices, a well known fluid reasoning test26.
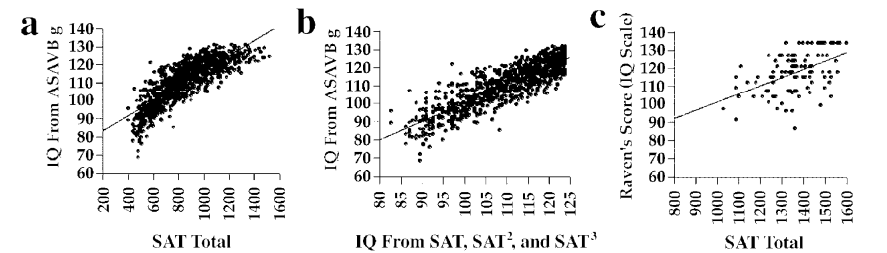
Fig. 1. Scatter plots of Scholastic Assessment Test (SAT) scores and IQ estimates: first-factor score (IQ scale) from the Armed Services Vocational Aptitude Battery (ASVAB) as a function of (a) SAT total score and (b) unstandardized predicted IQ based on SAT total score, SAT2, and SAT3 and (c) Raven's Advanced Progressive Matrices score (IQ scale) as a function of SAT total score26
Furthermore, as pointed out by Frey & Detterman, "it is evident from these results that there is a striking relation between SAT scores and measures of general cognitive ability. In fact, when one examines the results in [Fig. 2.], especially those in the ASVAB column, it appears that the SAT is a better indicator of g, as defined by the first factor of the ASVAB, than are some of the more traditional intelligence tests."26
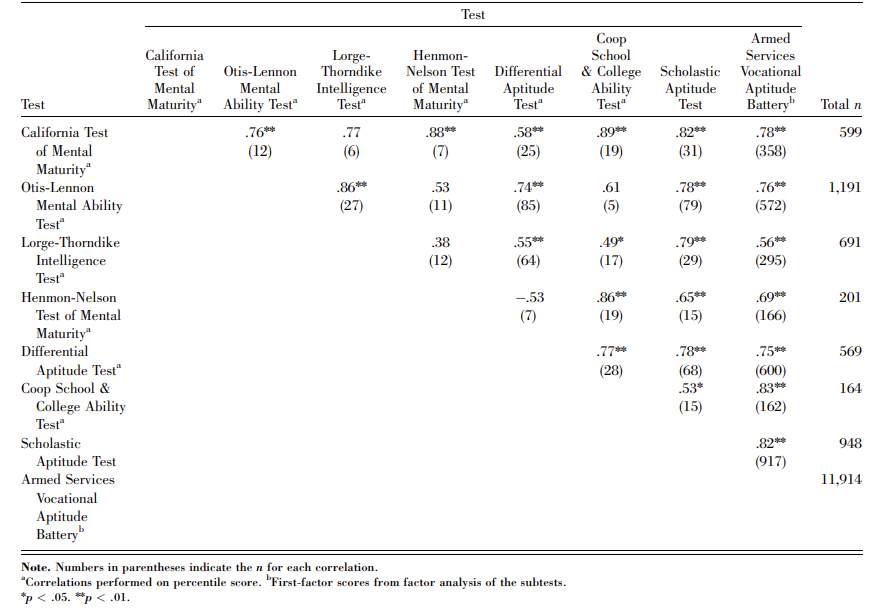
Fig. 2. Intercorrelation matrix of the SAT with other well known tests of g26
Another independent study of the SAT's value as an IQ test confirms the above findings. "In a study of 339 undergraduates, Brodnick and Ree (1995) used covariance structure modeling to examine the relationship between psychometric g, socioeconomic variables, and achievement-test scores. They found substantial general-factor loadings on both the math (.698) and the verbal (.804) SAT subtests."26 While they used the SAT itself to define their first factor as g, the evidence strongly suggests it measures the same first factor g measured by IQ tests. Another thing that should be kept in mind is that these loadings are deflated due to Spearman's Law of Diminishing Returns (SLODR), as the sample of students who took SATs were above average, college-bound high school graduates, placing them above the average 100 IQ population.
Why was the old SAT so g-loaded? Its creator, Princeton psychologist Carl Brigham, lifted item formats directly from the World War I Army Alpha intelligence tests he developed, meaning the exam's backbone was abstract analogies, antonyms, and logic puzzles that were always intended as an IQ test (and also the exact formats which the post-1994 revisions have removed).
The common objection of the SAT being skewed by the amount of prep time invested by test takers is directly contradicted by large-scale College Board studies, which put coaching gains at ~9-15 points on verbal and ~15-18 points on math27. Furthermore, there are heavy diminishing returns to the amount of time spent, as demonstrated in Fig. 3 below.
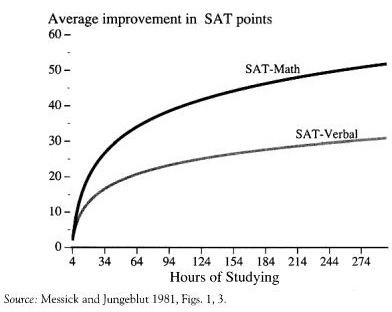
Fig. 3. The diminishing returns to coaching for the SAT28
The gains shown above equate to approximately between one to six IQ points- far too small to explain uncorrected correlations in the .70-.80 range with independent IQ measures. One theory as to the resistance of the SAT to the practice effect compared to other tests is its unique property of having multiple forms. Contrast that with most professionally administered IQ tests (such as the WAIS-IV or SB-V), which rely on a single copyrighted form that proctors have to guard. If a client or an internet leak reveals those items, the whole instrument is compromised until the publisher can fund and norm an alternate edition (a process which takes years). By design, the SAT's rotating forms limit any item-specific exposure that inflates retest scores on pro tests.
Few IQ tests have ever combined the accuracy of a top-tier FSIQ battery with the scale, form security, and predictive power of the pre-1994 SAT. With multiple peer reviewed independant studies reporting g correlations on par with how gold standard, professional tests correlate with each other, the old SAT can definitely stand with more conventional IQ tests. However, where the SAT is unique is, unlike pro tests given to a few thousand volunteers, the SAT was normed on millions of examinees every year and continuously equated every year. A vast, rotating item bank also meant each administration kept coaching effects trivial. Given the SAT's predictive validity with college and even mid-career outcomes in samples exceeding 200,000 students, the old SAT may be the most underappreciated intelligence test ever created.
Bias
"Verbal subtests are biased since they measure what people have learnt, not innate intelligence."
The point of an IQ test is to be a proxy for g, as g is a latent trait which cannot be directly observed. Modern batteries do this by sampling several broad abilities (fluid reasoning, crystallized knowledge, working memory, etc.) and then using their positive intercorrelations to extract a second-order g factor. Confirmatory-factor analyses of the WAIS-IV make this structure explicit: all four index scores (including Verbal Comprehension) load on a single g, with Vocabulary among the strongest indicators.29
There are centuries of empirical evidence that verbal items are not contaminants but some of the best g measures we have. In every large WAIS-IV sample Vocabulary's g-loading equals or exceeds that of Matrix Reasoning. Even a two-subtest form made up of Vocabulary + Matrix Reasoning explains roughly 70-88% of the variance in Full-Scale IQ (to the point where the WASI uses it as a 15-minute proxy for the full battery).30
Why does vocabulary work so well? Because the causal arrow runs g → learning rate → knowledge store, not the other way around. People who are higher g will need less exposure in order to understand a word and all of its nuances, allowing them to naturally develop a larger vocabulary. Longitudinal studies shows that higher early general ability predicts steeper later gains in both vocabulary and reasoning. A mutualism model even finds each skill accelerating the other during adolescence and early adulthood.31 Twin and SNP studies reinforce this logic: heritability for expressive vocabulary starts around 25% in toddlers and rises above 50% by the teens, mirroring the exact same developmental trajectory of g, while recent GWAS meta-analyses have identified polygenic scores that forecast early vocabulary growth and later reading skill.32 33
Dropping crystallized knowledge subtests would significantly hurt the accuracy of Full Scale IQ tests as well. Meta-analyses spanning decades show that full-scale IQ (including its verbal components) predicts educational attainment, job performance, and income better than any nonverbal only battery.34 By contrast, "culture-fair" tests such as Raven's matrices display lower g-loadings and weaker validity across diverse samples, which is why they have never replaced the Wechsler or Stanford Binet in clinical or selection settings.35 36 37
In fact, vocabulary item types are one of the most resistant to practice. A large meta-analysis of WAIS-IV retest data finds smaller practice gains for Vocabulary than for nonverbal subtests, meaning verbal scores are, if anything, more stable on retest.38
Vocabulary is not just memorization and luck, it's another expression of the same general learning ability that drives fluid reasoning and working memory.
Ethical/Political
"IQ was invented to promote eugenics, so the whole system is biased."
Although early-20th-century eugenicists did misuse IQ scores, that history doesn't discredit modern IQ testing any more than bloodletting discredits today's medicine. Alfred Binet's original 1905 test was designed to help French schoolchildren who needed extra support and he specifically made sure not to label people as inferior. While we rightly remember past abuses, the field has been far past that for over a decade now, making the "IQ is eugenics" argument outdated.
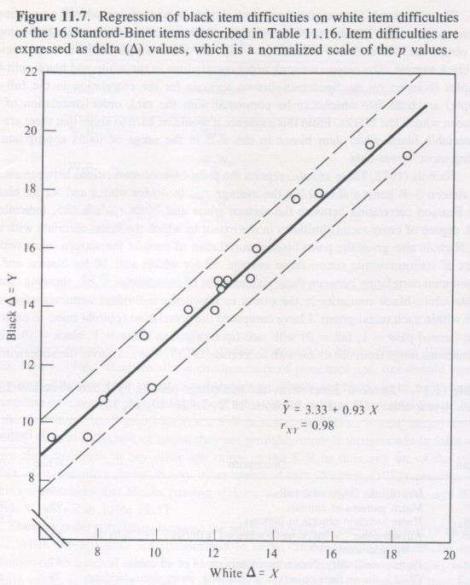
Fig. 1. Questions challenging for White examinees are equally challenging for Black examinees, illustrating an example of an empirical DIF check modern IQ tests use to show the lack of racial or cultural bias in IQ tests. (Jensen, Bias in Mental Testing)
Modern IQ batteries are built under the Standards for Educational and Psychological Testing, subjected to differential item functioning analyses to prune biased questions, audited by external reviewers, and validated against real-world outcomes that show similar predictive power across genders, ethnicities, and socioeconomic groups. Over the past century, psychometrics has undergone the same kind of rigorous overhaul that medicine, aviation, food science, or any other science-driven field you can name. Invoking past misuse doesn't invalidate modern intelligence testing anymore than it would for any other field.
Miscellaneous
"Richard Feynman was a genius but he only scored 125 IQ."
A common belief is that Feynman is 125 IQ. The test in which Feynman scored 125 was as an adolescent in high school, meaning his scores likely are not representative of his capabilities as an adult. We also cannot determine whether or not the test was a verbal test or a full-scale test, though it is heavily speculated it was a verbal test, meaning measurements of Feynman's strong fluid reasoning skills were likely neglected.
According to his biographer, in high school the brilliant mathematician Richard Feynman's score on the school's IQ test was a 'merely respectable 125' (Gleick, 1992, p. 30). It was probably a paper-and-pencil test that had a ceiling, and an IQ of 125 under these circumstances is hardly to be shrugged off, because it is about 1.6 standard deviations above the mean of 100. The general experience of psychologists in applying tests would lead them to expect that Feynman would have made a much higher IQ if he had been properly tested.
John Carroll (1996), The Nature of Mathematical Thinking (p. 9)
His IQ is most likely much higher than 125, but it's impossible to know by how much due to lack of information. It is common for people to use this outlier as a point against the accuracy of IQ; however, a lot of the details regarding Feynman's score are questionable.
"Chess skill is strongly correlated with IQ."
Contrary to the popular trope that "grandmasters are geniuses", the most comprehensive evidence to date shows only a modest link between intelligence and chess skill. Burgoyne et al.'s (2016) meta-analysis combined 82 effect sizes from 1,779 players across 19 studies and found that the broad CHC abilities most often touted as decisive (FRI, WMI, PRI) each correlate with chess performance at roughly r ≈ 0.24–0.25, explaining barely 6% of the variance each39. Full Scale IQ is even worse (r ≈ 0.10), mostly because the rating pools studied are in the upper-normal range.
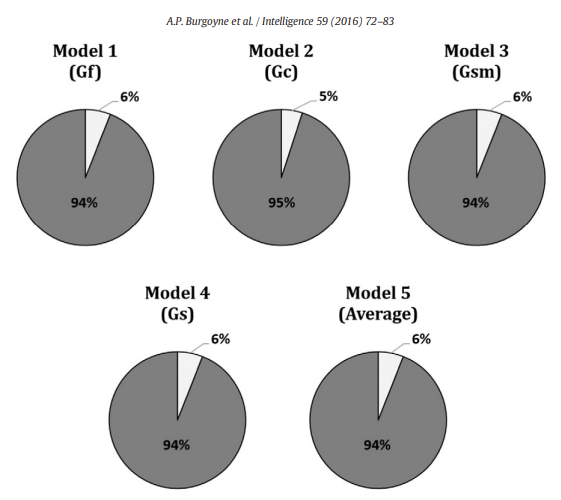
Fig. 1. Percentage of variance in chess skill explained (light gray) versus not explained (dark gray) by different measures of intelligence.39
Intelligence is the most important for children and beginners (r ≈ 0.32) and from there, shrink for ranked adults (r ≈ 0.11–0.14), showing that g mainly drives early learning but amount of time spent on practice, coaching, and knowledge dominate at the higher level.
Chess players such as Kasparov and Judit Polgar have both been tested, and Kasparov scored 135 when he was tested by a magazine that employed psychologists, which is high, but not rare genius level. The data shows that an extra ten IQ points pales beside systematically studying of the game when it comes to Elo ratings. While, intelligence offers a small but reliable head start, it doesn't substitute for the relentless training that separates grandmasters from weekend players.
References
Footnotes
-
https://arthurjensen.net/wp-content/uploads/2020/04/The-g-factor-the-science-of-mental-ability-Arthur-R.-Jensen.pdf ↩
-
https://emilkirkegaard.dk/en/wp-content/uploads/Intelligence-and-socioeconomic-success-A-meta-analytic-review-of-longitudinal-research.pdf ↩
-
https://www.taylorfrancis.com/books/edit/10.4324/9781410600240/exploring-limits-personnel-selection-classification-john-campbell-deirdre-knapp ↩
-
https://dspace.ut.ee/server/api/core/bitstreams/6ea26618-56b2-43a0-8e4a-2586d117cac9/content ↩ ↩2 ↩3
-
https://www.tandfonline.com/doi/full/10.1080/13854046.2024.2335117 ↩
-
https://www.researchgate.net/publication/343166876_An_Examination_of_the_Convergent_Validity_of_the_ICAR16_and_WAIS-IV ↩
-
https://www.sciencedirect.com/science/article/pii/S0160289606000201 ↩
-
https://www.sciencedirect.com/science/article/pii/S016028960300062X ↩
-
https://citeseerx.ist.psu.edu/document?repid=rep1&type=pdf&doi=a6547cae0a3127e0a2454a0393a51d317cc6a5a0 ↩
-
https://gwern.net/doc/iq/high/1947-terman-thegiftedchildgrowsup.pdf ↩
-
https://edci6300introresearch.pbworks.com/f/poropat+2009+metaanalysis+FFM.pdf ↩
-
https://www.researchgate.net/profile/Frank-Schmidt-2/publication/232564809_The_Validity_and_Utility_of_Selection_Methods_in_Personnel_Psychology/links/53e2938f0cf216e8321e0625/The-Validity-and-Utility-of-Selection-Methods-in-Personnel-Psychology.pdf ↩
-
https://www.researchgate.net/publication/304032119_Much_Ado_About_Grit_A_Meta-Analytic_Synthesis_of_the_Grit_Literature ↩
-
https://www.sciencedirect.com/science/article/abs/pii/S0160289622000125/ ↩
-
https://en.wikipedia.org/wiki/Kendall_rank_correlation_coefficient#Case_of_standard_normal_distributions ↩
-
https://www.mail-archive.com/futurework@scribe.uwaterloo.ca/msg05978.html ↩ ↩2
-
https://gwern.net/doc/iq/high/smpy/2004-frey.pdf ↩ ↩2 ↩3 ↩4 ↩5
-
https://onlinelibrary.wiley.com/doi/epdf/10.1002/j.2333-8504.1980.tb01209.x ↩
-
https://www.researchgate.net/publication/278045836_Dyadic_Short_Forms_of_the_Wechsler_Adult_Intelligence_Scale-IV ↩
-
https://www.sciencedirect.com/science/article/pii/S0006322323017572 ↩
-
https://www.scribd.com/document/513632617/Schmidt-Hunter-2004 ↩
-
https://www.sciencedirect.com/science/article/abs/pii/S0160289615001002 ↩
-
https://www.ux1.eiu.edu/~glcanivez/Adobe%20pdf/Publications-Papers/Canivez%20%282008%29%20SB-SL.pdf ↩
-
https://artscimedia.case.edu/wp-content/uploads/sites/141/2016/12/22143817/Burgoyne-Sala-Gobet-Macnamara-Campitelli-Hambrick-2016.pdf ↩ ↩2