

Preliminary Validity Technical Report
1. Introduction
The Comprehensive Online Reasoning Exam (CORE) is a free, community-developed online cognitive assessment created by prominent members of the r/cognitiveTesting community. CORE is based on the Cattell-Horn-Carroll (CHC) theory of intelligence and is designed to measure general cognitive ability (g) and its major broad domains to an accuracy comparable to professional tests, such as the Wechsler Adult Intelligence Scale (WAIS) and the Stanford-Binet. Each of the indices and subtests on CORE were carefully chosen based on CHC literature and reflect the best-of professional tests up to this point. For further detail on rationale, check out the CORE test structure overview .
This will be a preliminary report evaluating CORE's validity as a psychometric test, with sample characteristics, data preparation, reliability, evidence of construct validity, corrections, and loadings. At the time of this analysis, the Comprehension subtest won't be included in the factor analysis due to not having enough attempts, but it will be incorporated in future analyses as additional data is collected. A more comprehensive CORE Technical Manual is in planned development as well.
If you are interested in reading more about the project or taking the test, check out the CORE overview page .
2. Methods
2.1 Participants
The analytic sample included N = 4,723 individuals who completed all or part of CORE on cognitivemetrics.com, an openly accessible cognitive testing website. Because the test is free and publicly available and most participants likely encounter it through r/cognitiveTesting, participants are self-selected and likely have a pre-existing interest in IQ or cognitive testing.
Even so, the resulting sample exhibited substantial demographic diversity in age and geographic background.
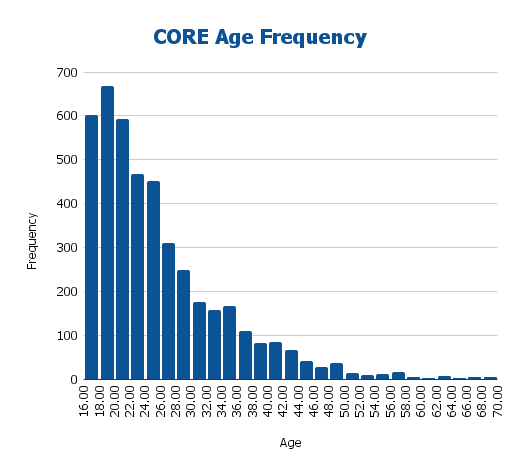
| Age Group | n | % |
|---|---|---|
| 16-17 | 660 | 13.97% |
| 18-19 | 716 | 15.16% |
| 20-24 | 1379 | 29.19% |
| 25-29 | 854 | 18.09% |
| 30-34 | 443 | 9.39% |
| 35-44 | 483 | 10.22% |
| 45-54 | 125 | 2.64% |
| 55-64 | 46 | 0.97% |
| 65+ | 17 | 0.37% |
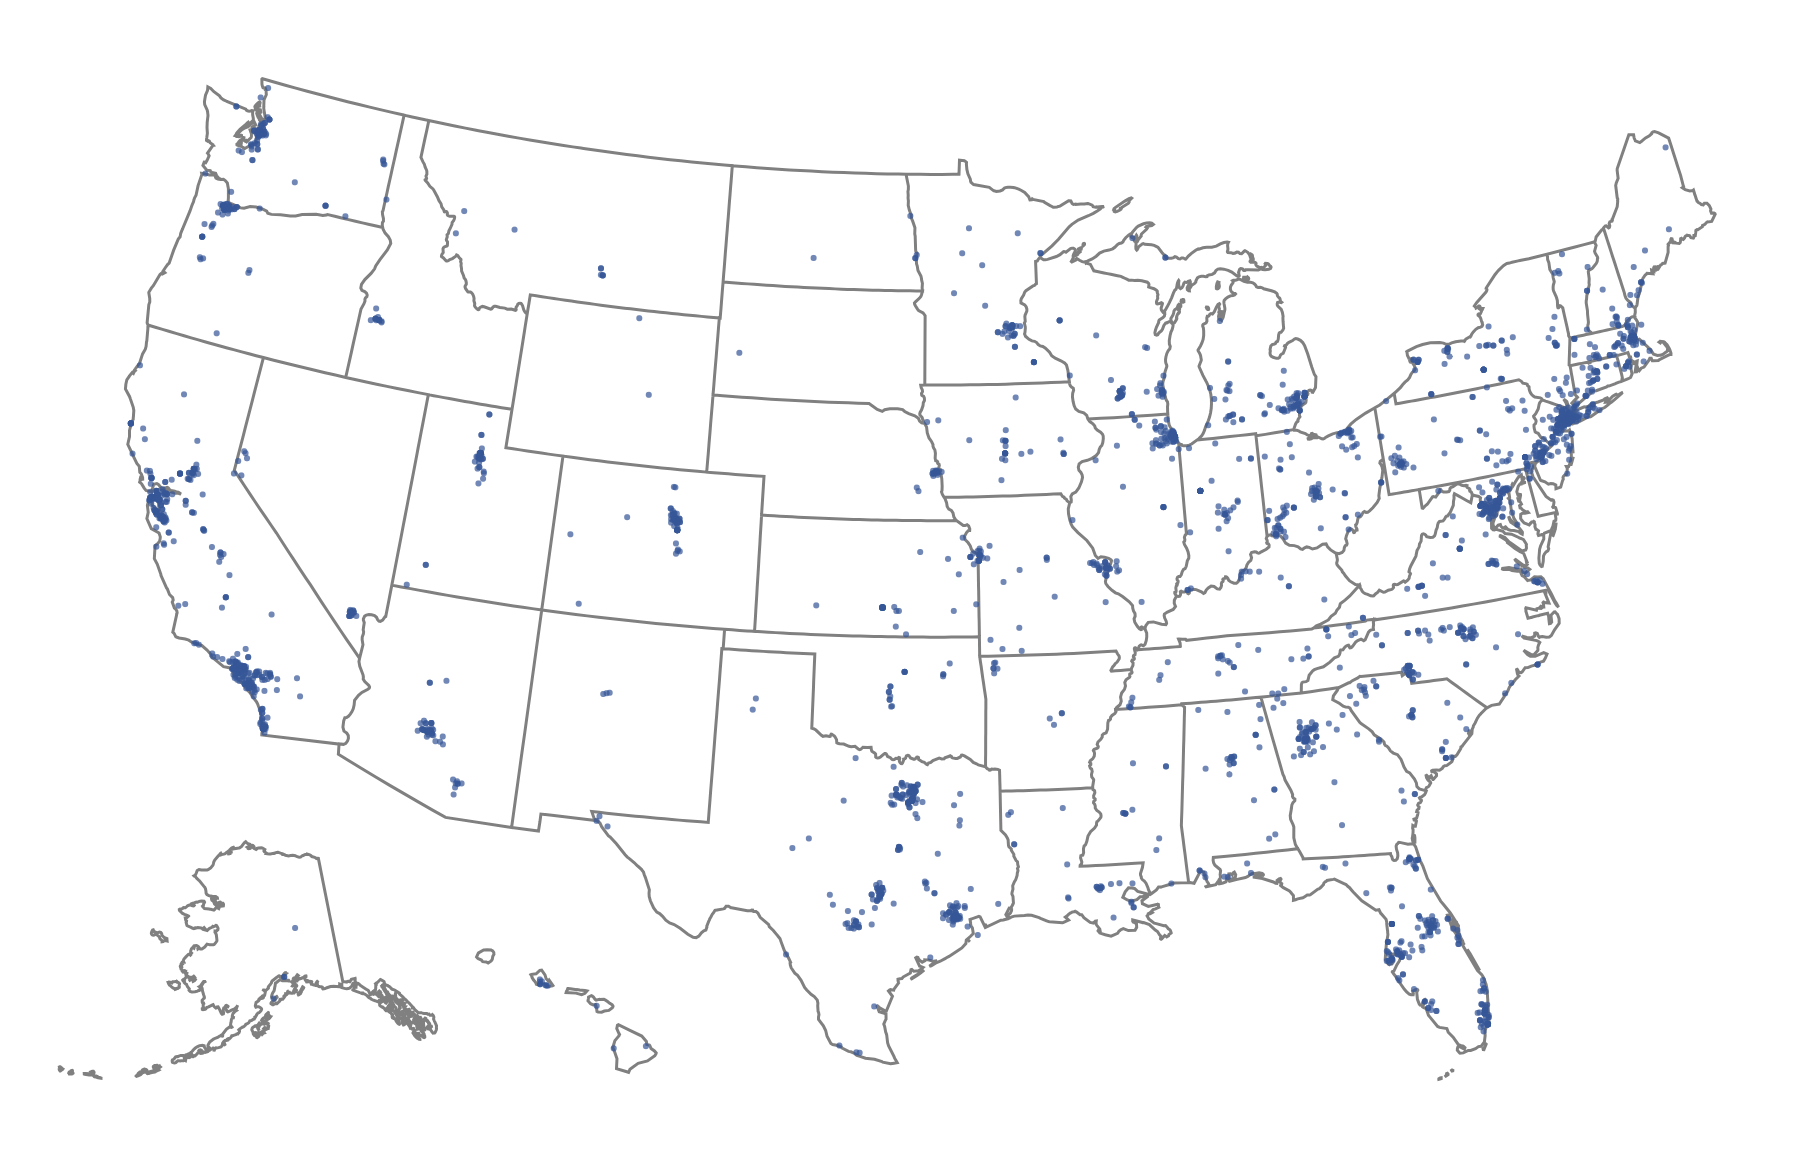
Since the test is administered in English, the sample was restricted to individuals residing in English-speaking Anglospheric countries: the United States, Canada, the United Kingdom, Australia, and New Zealand. Within these countries, the dataset still displayed broad geographic diversity. For example, American participants represented all 50 states, as illustrated by the map in Figure 2, indicating that the sample was not drawn from a very narrow population.
Table 2. CORE Sample National Frequencies
| Country | n |
|---|---|
| United States | 3,207 |
| Canada | 564 |
| United Kingdom | 542 |
| Australia | 382 |
| New Zealand | 28 |
Descriptive statistics are provided to further contextualize the sample.
Table 3. Sample Descriptive Statistics
| Statistic | Median | Mean | St. Dev |
|---|---|---|---|
| Age | 23 | 25.31 | 8.84 |
| FSIQ | 123 | 123.49 | 12.41 |
| VCI | 123 | 123.18 | 11.16 |
| FRI | 122 | 121.12 | 12.77 |
| VSI | 118 | 117.94 | 12.84 |
| QRI | 122 | 122.02 | 12.57 |
| WMI | 119 | 118.77 | 18.25 |
| PSI | 117 | 116.71 | 14.50 |
| AG | 14 | 13.58 | 2.23 |
| AN | 14 | 14.29 | 2.00 |
| IN | 14 | 13.87 | 2.54 |
| CO | 15 | 14.58 | 2.39 |
| MR | 13 | 12.87 | 2.96 |
| GM | 14 | 13.78 | 2.62 |
| FW | 14 | 13.82 | 2.09 |
| FS | 14 | 13.76 | 2.62 |
| VP | 14 | 13.64 | 2.69 |
| SA | 12 | 12.32 | 2.85 |
| BC | 13 | 13.27 | 2.50 |
| QK | 14 | 14.06 | 2.59 |
| AR | 13 | 13.70 | 2.41 |
| DLS | 14 | 13.25 | 3.54 |
| DS | 12 | 12.33 | 3.56 |
| CP | 13 | 13.14 | 3.11 |
| SS | 12 | 12.29 | 2.99 |
2.2 Data Preparation
Before model estimation, the data was cleaned and processed. A total of 1,099 unique missing-data patterns were identified across the subtests, which is due to variability in voluntary test-taking (not everyone took every subtest). Furthermore, invalid test attempts (such as instances where participants didn't engage meaningfully with the subtest or appeared to use external aids) were removed. The specific detection methodology will not be described in detail in this report in order to preserve the integrity of the cheating-detection process.
Following data cleaning, missingness was handled by using full-information maximum likelihood (FIML) under the MLR (maximum likelihood with robust standard errors) estimator in lavaan. This uses all available information for each participant and produces unbiased parameter estimates under the assumption that data are missing at random. Subtest distributions were examined for normality and outliers as well.
3. Evidence of Reliability
Table 4. CORE Subtest Reliability Coefficients
| Subtest | Conditional* | Cronbach's α | Split-half | Test-retest | Cronbach's αrr | Split-halfrr | Test-retestrr |
|---|---|---|---|---|---|---|---|
| AG | 0.8121 | 0.7398 | 0.7420 | 0.8227 | 0.8244 | ||
| AN | 0.9170 | 0.8438 | 0.8543 | 0.9231 | 0.9289 | ||
| IN | 0.8664 | 0.8228 | 0.8335 | 0.8564 | 0.8656 | ||
| CO | 0.8496 | 0.8681 | 0.8962 | 0.8975 | 0.9202 | ||
| MR | 0.8221 | 0.7563 | 0.7691 | 0.7621 | 0.7747 | ||
| GM | 0.8721 | 0.8054 | 0.8148 | 0.8378 | 0.8461 | ||
| FW | 0.8840 | 0.7881 | 0.8133 | 0.8746 | 0.8916 | ||
| FS | 0.8224 | 0.7621 | 0.7716 | 0.8043 | 0.8127 | ||
| VP | 0.8774 | 0.7739 | 0.7809 | 0.8047 | 0.8111 | ||
| SA | 0.8037 | 0.7466 | 0.7625 | 0.7646 | 0.7798 | ||
| BC | 0.8634 | 0.8179 | 0.8645 | 0.8642 | 0.9011 | ||
| QK | 0.8421 | 0.7960 | 0.8444 | 0.8358 | 0.8769 | ||
| AR | 0.8403 | 0.7790 | 0.7859 | 0.8426 | 0.8481 | ||
| DLS | 0.7456 | 0.7456 | |||||
| DS | 0.8277 | 0.8277 | |||||
| CP | 0.7565 | 0.7590 | |||||
| SS | 0.7043 | 0.7272 |
*: IRT conditional reliability at the 10ss ability level.
rr: corrected for indirect range restriction using Thorndike's formula.
Multiple indices of reliability were used to examine CORE subtests and composites, including IRT-based conditional reliability, Cronbach's α internal consistency, split-half reliability, and test-retest reliability (where applicable). Because the sample is a high-ability sample (mean FSIQ = 123.49), conventional reliability estimates are expected to be biased downward due to range restriction. For this reason, we recommend referring to IRT Conditional Reliability at the 10ss ability level as it is a metric most directly comparable to reliability coefficients reported by professional tests.
For Working Memory and Processing Speed subtests, test-retest reliability was used in place of internal consistency measures of reliability, since it would be inappropriate to use internal consistency to measure speeded or randomized memory tasks. The retest interval used was 5 or more days between attempts to minimize practice effects.
4. Evidence of Validity
4.1 Confirmatory Factor Analysis
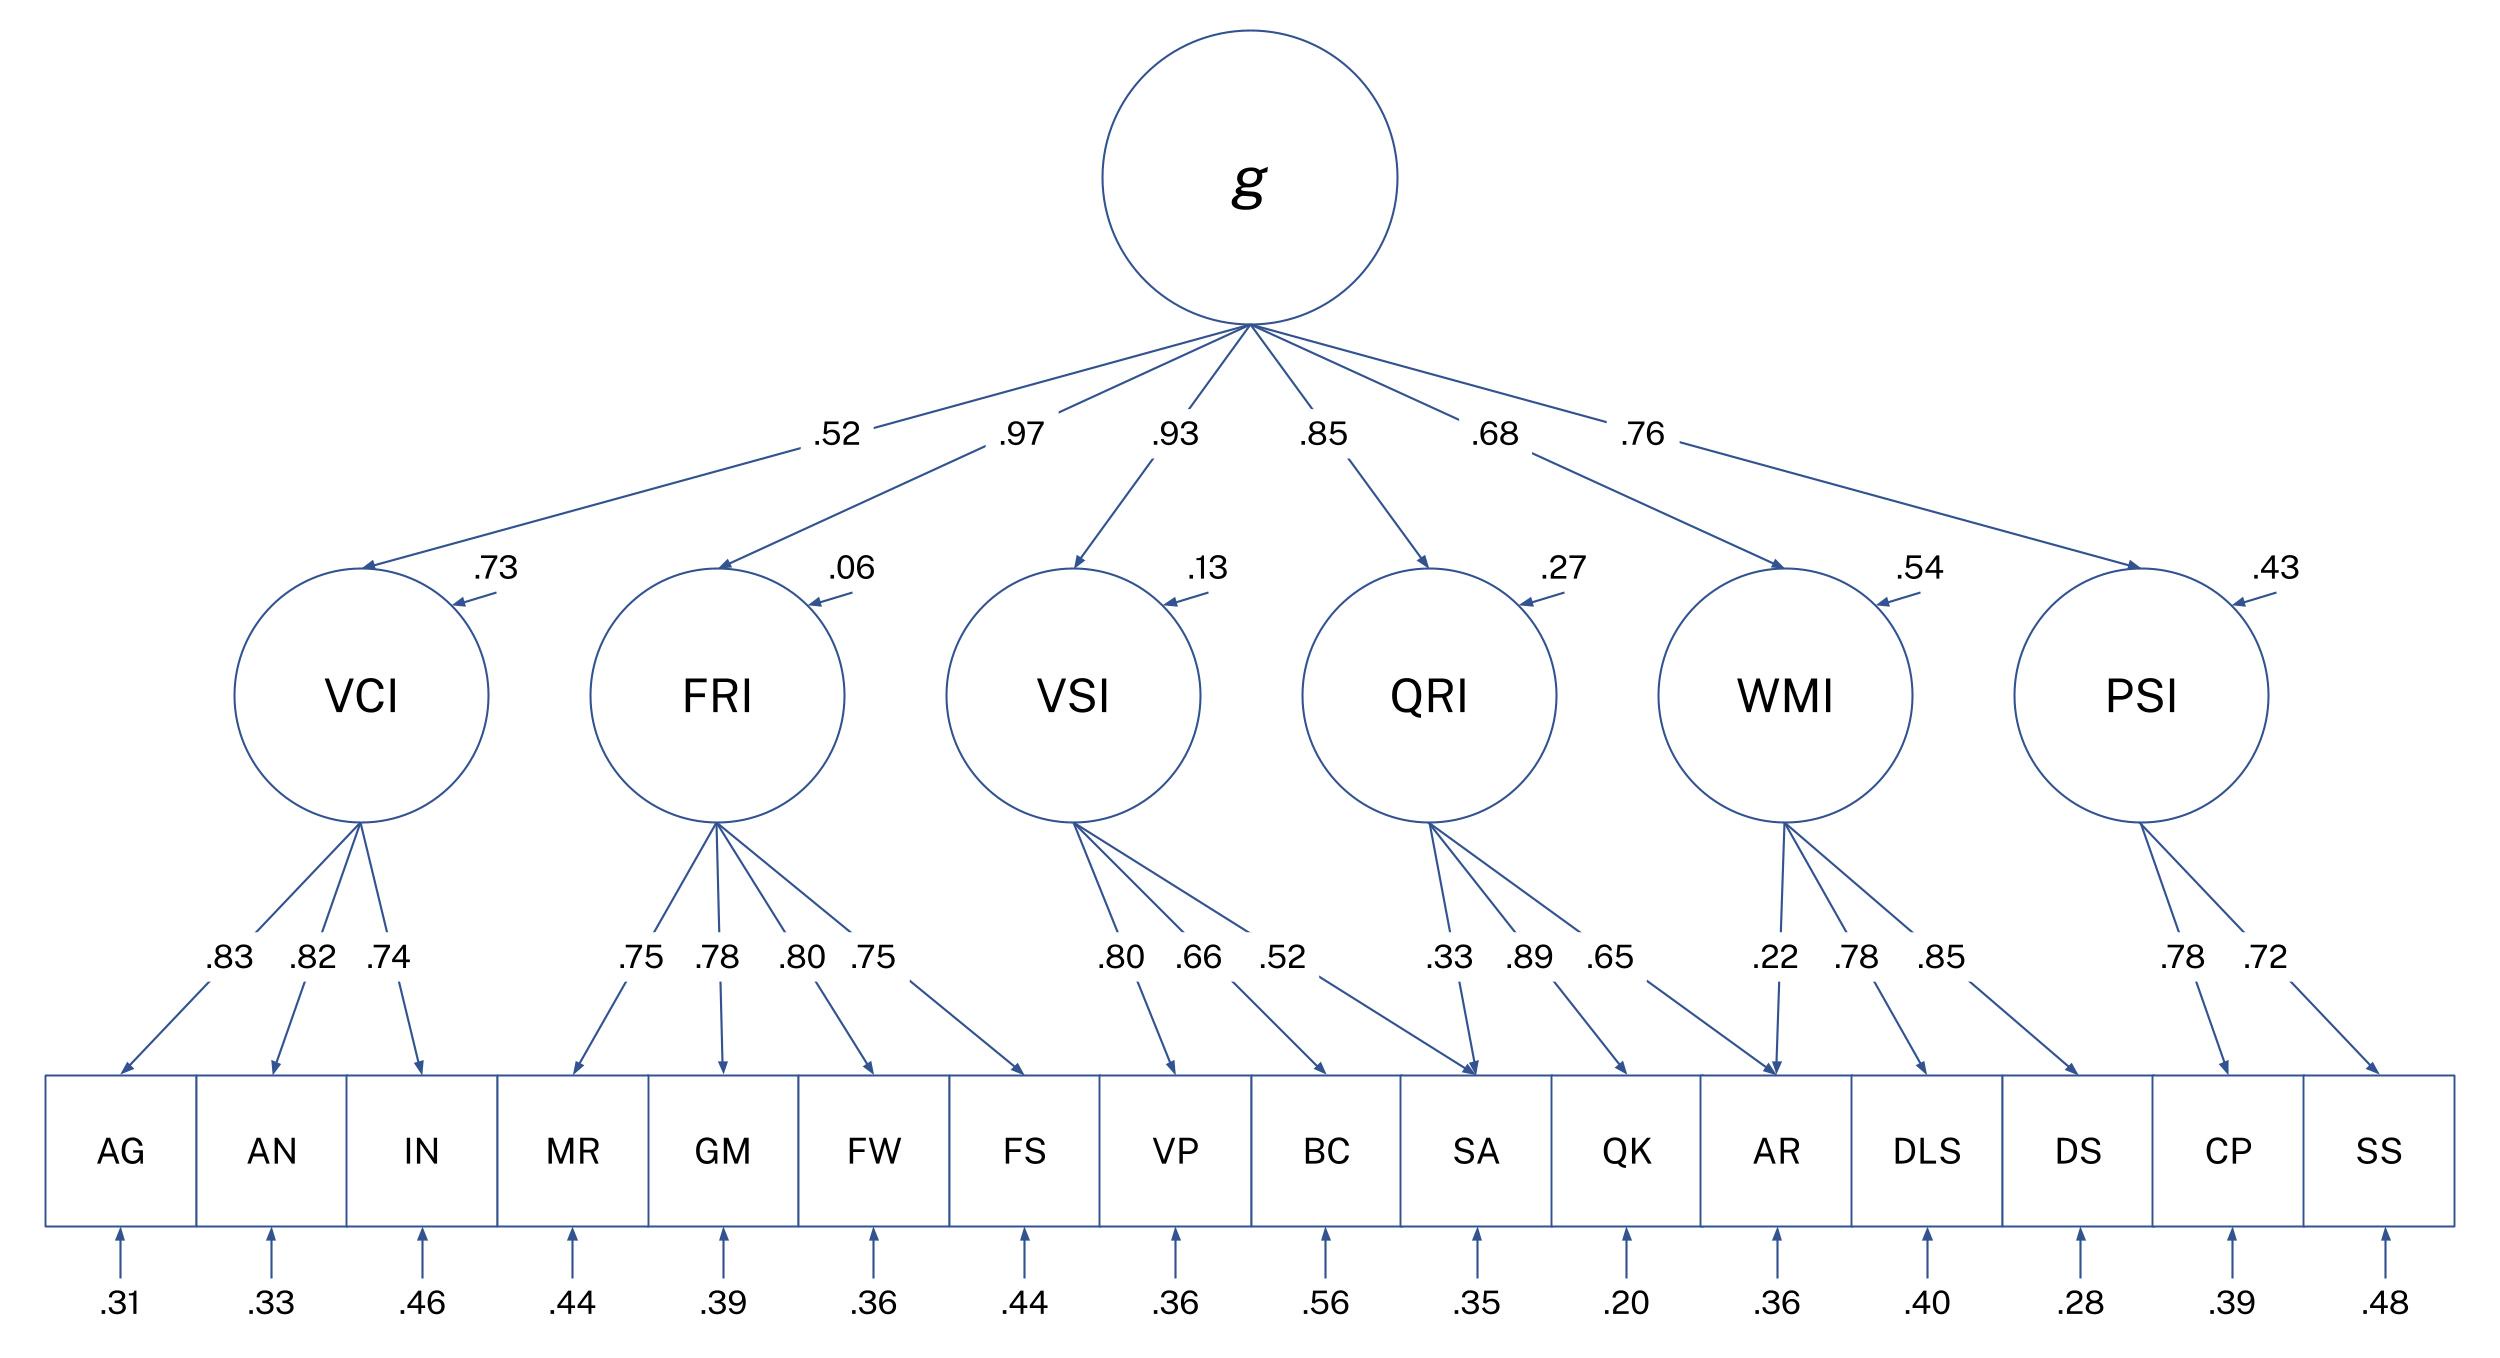
Hierarchical Model:
Lavaan Output:
    lavaan 0.6-19 ended normally after 145 iterations

    Estimator                                         ML
    Optimization method                           NLMINB
    Number of model parameters                        56

                                                    Used       Total
    Number of observations                          4476        4723
    Number of missing patterns                      1099

    Model Test User Model:
                                                Standard      Scaled
    Test Statistic                               229.953     228.600
    Degrees of freedom                                96          96
    P-value (Chi-square)                           0.000       0.000
    Scaling correction factor                                  1.006
    Yuan-Bentler correction (Mplus variant)

    Model Test Baseline Model:

    Test statistic                              5722.770    5534.734
    Degrees of freedom                               120         120
    P-value                                        0.000       0.000
    Scaling correction factor                                  1.034

    User Model versus Baseline Model:

    Comparative Fit Index (CFI)                    0.976       0.976
    Tucker-Lewis Index (TLI)                       0.970       0.969

    Robust Comparative Fit Index (CFI)                         0.972
    Robust Tucker-Lewis Index (TLI)                            0.965

    Loglikelihood and Information Criteria:

    Loglikelihood user model (H0)             -37382.618  -37382.618
    Scaling correction factor                                  1.013
    for the MLR correction
    Loglikelihood unrestricted model (H1)     -37267.641  -37267.641
    Scaling correction factor                                  1.008
    for the MLR correction

    Akaike (AIC)                               74877.236   74877.236
    Bayesian (BIC)                             75235.999   75235.999
    Sample-size adjusted Bayesian (SABIC)      75058.053   75058.053

    Root Mean Square Error of Approximation:

    RMSEA                                          0.018       0.018
    90 Percent confidence interval - lower         0.015       0.015
    90 Percent confidence interval - upper         0.021       0.020
    P-value H_0: RMSEA <= 0.050                    1.000       1.000
    P-value H_0: RMSEA >= 0.080                    0.000       0.000

    Robust RMSEA                                               0.051
    90 Percent confidence interval - lower                     0.041
    90 Percent confidence interval - upper                     0.061
    P-value H_0: Robust RMSEA <= 0.050                         0.405
    P-value H_0: Robust RMSEA >= 0.080                         0.000

    Standardized Root Mean Square Residual:

    SRMR                                           0.036       0.036

    Parameter Estimates:

    Standard errors                             Sandwich
    Information bread                           Observed
    Observed information based on                Hessian
Table 5. Comparison of CORE Fit Indices against other professional IQ tests
| Fit Indices | CORE | WAIS-V | SB-V | WJ-V | RIOT |
|---|---|---|---|---|---|
| CFI | 0.976 | 0.97 | 0.94 | 0.70 | 0.950 |
| TLI | 0.970 | 0.97 | 0.93 | 0.68 | |
| RMSEA | 0.018 | 0.04 | 0.076 | 0.110 | 0.058 |
| SRMR | 0.036 | 0.067 | 0.045 |
The higher-order CORE hierarchical model demonstrated excellent overall fit to the data (CFI = .976, TLI = .970, RMSEA = .018, SRMR = .036), indicating that the proposed CHC-consistent structure provides an accurate representation of the observed covariance matrix.
For comparison, fit indices from other tests were taken from their respective technical manuals, except for RIOT's, which was taken from RIOT Technical Report No. 2025-01, updated on 08/26/2025. For the Stanford-Binet Fifth Edition (SB-V), values were taken from the ages 17-50 sample using Model 5 (which represents the CHC-aligned hierarchical model) reported in the manual. For the Woodcock-Johnson V (WJ-V), values were taken from the ages 20-49 sample using the Carroll hierarchical g broad CHC model.
Taken together, the fit statistics indicate that CORE's hierarchical structure performs at the very least comparably, if not better, to established professional batteries while preserving strong theoretical coherence within the CHC framework.
In addition to the hierarchical model above, multiple alternate models were tested as well. Some of these models include:
- Combining Fluid Reasoning (FRI), Visual-Spatial Ability (VSI), and Quantitative Reasoning (QRI) into a single Perceptual Reasoning (PRI) factor
- Merging QRI into FRI
- Modeling Figure Weights (FW) under QRI rather than FRI
- Other various theoretically plausible cross-loadings and different subtest-factor assignments
While several of these variants produced acceptable fit, none matched the reported model in terms of the combined criteria of overall fit, factor interpretability, theoretical coherence with CHC theory, and stability of parameter estimates. Therefore the final hierarchical model represents the most theoretically defensible and best-fitting model out of those tested. The upcoming technical manual will go through this process in far greater detail.
4.2 Corrections
As some may have noticed, there are some anomalies with the VCI factor. While the subtests intercorrelate very strongly with one-another and load strongly on the VCI broad factor, the factor itself loads much more weakly on g than one would expect, indicating strong non-g covariance between the subtests. This effect is just a symptom of a well-documented phenomenon of Spearman's Law of Diminishing Returns (SLODR).
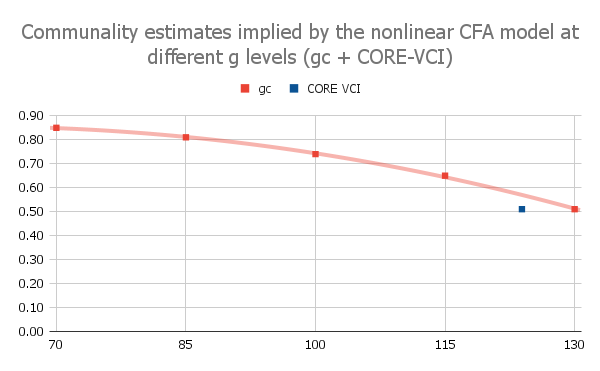
Figure 4 reproduces the nonlinear relationship between Verbal Comprehension g-loadings and ability level reported by Reynolds et al. (2011) for the DAS-II and overlays the corresponding CORE VCI factor loading onto the same function. The CORE sample (mean VCI = 123.18) falls close to the g-loadings predicted by the pattern observed in the DAS-II normative data. Accordingly, the observed CORE VCI g-loading in this dataset cannot be directly compared to g-loadings reported from professional intelligence tests, which are typically estimated from general population samples.
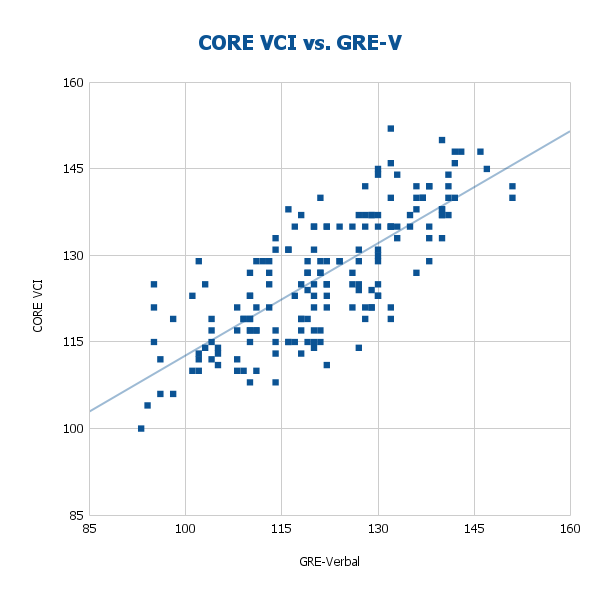
As shown in Figure 5, the uncorrected correlation between CORE VCI and the old GRE Verbal subtest is very strong within the CORE sample (r = .771). Prior research indicates that the GRE Verbal factor is highly g-loaded in general population samples, with hierarchical factor models estimating a loading of approximately .81 on g (Wilson, 1984). Remember these numbers for later, they will be crucial while we calculate the corrected values.
This relationship provides even further justification for applying a correction when standardizing CORE VCI loadings for comparison with professional intelligence tests. Therefore, a correction is necessary to estimate the latent CORE VCI → g relationship on a general population sample to allow proper comparisons with other professional IQ tests.
Calculating the necessary correction
The product of the latent VCI→g loading and the latent GRE-V→g loading equals the observed VCI-GRE correlation minus the non-g covariance shared between the two verbal measures, demonstrated by the following:
λCORE-VCI→g × λGRE-V→g = rCORE-VCI, GRE-Vlatent - covCORE-VCI, GRE-V(non-g)
Using this formula, we can solve for λCORE-VCI→g, which will be our estimated CORE-VCI factor loading on g using a normal sample. Confirmatory factor analysis shows λGRE-V→g to be 0.81.
Solving for rCORE-VCI, GRE-V at the latent level
CORE VCI correlates strongly with GRE-Verbal (r = .771) for the CORE sample (n=1,079), which itself has been shown to be highly g-loaded in normative samples.
After the following reliability correction:
The true latent correlation (rCORE-VCI, GRE-Vlatent) between CORE VCI and GRE-V increases to .889.
Estimating covCORE-VCI, GRE-V(non-g)
We will use the convergent validity tables between various pro-tests, WJ-IV, WJ-V, WAIS-IV, DAS-II, and WAIS-V to calculate the VCI factors' covariance and use it to estimate possible values between CORE-VCI and GRE-V. For brevity, we will refer to the non-g, VCI-specific covariance between CORE-VCI and GRE-V as z in this section.
Case 1:
From the WJ-IV Technical Manual, we know the correlation between WJ-IV Gc and WAIS-IV VCI is 0.74 and the correlation between WJ-IV Gc and WAIS-IV FSIQ is 0.70. We also have the correlation between WAIS-IV FSIQ and WAIS-IV VCI as 0.78 from the WAIS-IV Technical Manual.
Without correcting for reliability, we can calculate z by multiplying Gc-FSIQ with VCI-FSIQ and subtracting that from Gc-VCI to isolate the non-g VCI specific covariance.
zobserved = 0.74 − (0.70)(0.78) = 0.194
However, we want it on the latent level so let's correct for error first. We have the reliability of WJ-IV Gc as 0.93, reliability of WAIS-IV VCI as 0.96, and reliability of WAIS-IV FSIQ as 0.98 from their respective technical manuals. Let's correct each correlation:
r(WJ-IV Gc and WAIS-IV VCI) corrected: 0.74 (0.93×0.96) = 0.783
r(WJ-IV Gc and WAIS-IV FSIQ) corrected: 0.70 (0.93×0.98) = 0.733
r(WAIS-IV VCI and WAIS-IV FSIQ) corrected: 0.78 (0.96×0.98) = 0.804
zlatent = 0.783 − (0.733)(0.804) = 0.1936
Because the reliabilities are very high and similar, the corrections mostly cancel, so latent z ≈ observed z here.
Case 2:
Reusing 0.78 as the correlation between WAIS-IV FSIQ and WAIS-IV VCI from Case 1, we have 0.86 as the correlation between WJ-V Gc and WAIS-IV VCI and 0.80 as the correlation between WJ-V Gc and WAIS-IV FSIQ from the WJ-V Technical Manual. Now we can calculate zobserved.
zobserved = 0.86 − (0.80)(0.78) = 0.236
We have the reliability of WJ-V Gc as 0.93, reliability of WAIS-IV VCI as 0.96, and reliability of WAIS-IV FSIQ as 0.98 from their respective technical manuals.
Let's correct each correlation:
r(WJ-V Gc and WAIS-IV VCI) corrected: 0.86 (0.93×0.96) = 0.910
r(WJ-V Gc and WAIS-IV FSIQ) corrected: 0.80 (0.93×0.98) = 0.838
r(WAIS-IV VCI and WAIS-IV FSIQ) corrected: 0.78 (0.96×0.98) = 0.804
zlatent = 0.910 − (0.838)(0.804) = 0.236
Again, extremely close to the observed value.
Case 3:
According to the WAIS-V Technical Manual, the correlation between WAIS-V VCI and WAIS-V FSIQ is 0.80, the correlation between DAS-II VA and WAIS-V VCI is 0.84, and the correlation between DAS-II VA and WAIS-V FSIQ is 0.80. We can now calculate zobserved.
zobserved = 0.84 − (0.80)(0.80) = 0.200
Since we have repeatedly observed that zobserved ≈ zlatent, we will use zobserved due to lack of access to the DAS-II manual for the reliability of VA.
Final Analysis
Looking back, we have the following
rCORE-VCI, GRE-V = 0.889
λGRE-V→g = 0.81
zWJ-IV, WAIS-IV = 0.194
zWJ-V, WAIS-IV = 0.236
zDAS-II, WAIS-V = 0.200
zavg = 0.210
Solving for λCORE-VCI→g in the formula, for each case we can estimate it as as:
Case zWJ-IV, WAIS-IV: 0.858
Case zWJ-V, WAIS-IV: 0.806
Case zDAS-II, WAIS-V: 0.851
Case zavg: 0.838
This is directly in line with the literature on the latent Gc/VCI factor to g from professional tests falling between ~0.80 - 0.85
Limitations
Although the correction improves cross-test comparability and situates CORE VCI appropriately with other VCI tests, several limitations should be acknowledged. First, the non-g covariance term (z) is estimated from convergent-validity data across other batteries rather than directly calculated from CORE, introducing a degree of approximation. It is impossible to calculate “z” in CORE directly without a general population normative sample, which would ironically render the correction itself as unneeded. Second, SLODR effects are nonlinear, ability-dependent, and index-specific, therefore this adjustment simplifies a complex psychometric phenomenon. Finally, these corrections are for population-level construct validity, not individual score interpretation. It also remains a subject of inquiry why only VCI seems to be affected by SLODR and not other indices.
While WMI does seem to be deflated at the factor level as well, we are unable to test for it at the time due to lack of correlations between CORE WMI and an established measure of WMI. However, CORE WMI closely follows the format of WAIS-IV and WAIS-V WMI, it is speculated that CORE WMI would behave similarly on a general population sample.
Discussion
In the earlier CFA, the VCI factor appeared disproportionately deflated relative to other indices. This pattern is theoretically consistent with the nature of crystallized knowledge and investment theory: as ability increases, individuals accumulate and specialize in verbal knowledge along increasingly idiosyncratic trajectories shaped by education, culture, interests, and experience, thereby increasing domain-specific variance and decreasing variance due to g. The fact that CORE VCI correlates strongly with old GRE-Verbal, a very g-loaded measure of verbal intelligence in the general population, reinforces this interpretation.
For this reason, estimating CORE VCI's latent g loading required (a) reliability correction, (b) correction for indirect range restriction, and (c) subtraction of non-g verbal covariance (≈ .20-.24), followed by division by GRE-V's latent g loading. This procedure yields an adjusted latent g loading of approximately .84, fully consistent with the g loadings of VCI/Gc factors in psychometric literature. The implication is that CORE VCI is not inherently less g-loaded than other VCI tests, rather, its apparent deflation is an artifact of sample selection and SLODR.
4.3 Subtest g-Loadings
Table 6. Comparison of CORE Subtest g-loadings against other professional IQ tests
| CORE | WAIS-V | SB-V | RIOT | ||||
|---|---|---|---|---|---|---|---|
| Subtest | Loadings | Subtest | Loadings | Subtest | Loadings | Subtest | Loadings |
| AG | 0.70c | VC | 0.69 | VKN | 0.70 | AG | 0.55 |
| AN | 0.69c | SI | 0.65 | NVKN | 0.77 | IN | 0.59 |
| IN | 0.62c | IN | 0.65 | VFR | 0.74 | VC | 0.60 |
| MR | 0.73 | CO | 0.66 | NVFR | 0.66 | FW | 0.72 |
| GM | 0.76 | MR | 0.73 | VVS | 0.81 | MR | 0.70 |
| FW | 0.78 | FW | 0.78 | NVVS | 0.71 | VP | 0.66 |
| FS | 0.73 | AR | 0.74 | VQR | 0.81 | OR | 0.69 |
| VP | 0.74 | SR | 0.70 | NVQR | 0.79 | SO | 0.83 |
| SA | 0.76 | BD | 0.73 | VWM | 0.72 | SV | 0.71 |
| BC | 0.61 | VP | 0.74 | NVWM | 0.70 | CS | 0.46 |
| QK | 0.76 | SSp | 0.65 | EM | 0.40 | ||
| AR | 0.70 | SAd | 0.68 | VR | 0.54 | ||
| DLS | 0.53 | DSq | 0.61 | AM | 0.33 | ||
| DS | 0.58 | DF | 0.53 | SS | 0.49 | ||
| CP | 0.59 | DB | 0.61 | sRT | 0.44 | ||
| SS | 0.55 | RD | 0.42 | cRT | 0.43 | ||
| LNS | 0.63 | ||||||
| CD | 0.57 | ||||||
| SS | 0.56 | ||||||
| NSO | 0.39 | ||||||
c: corrected loading
Comparison of subtest g-loadings in Table 6 indicates that CORE subtests are highly similar to those of professionally standardized intelligence tests. Across batteries, CORE subtests exhibit g-loadings that closely match or even exceed those observed in the WAIS-V, SB-V, and RIOT, with most loadings falling in the same general range or better as professional subtests. Importantly, CORE measures psychometric g in a manner that is indistinguishable in structure and magnitude from professional IQ assessments. Taken together, these results indicate that CORE is at least as g-loaded as established intelligence tests, supporting its validity as a general cognitive ability measure.
5. Is CORE deflated or inflated?
Many claims have been circulating regarding CORE's norms, with many claiming it to be deflated, while others claim it to be inflated. This section aims to analyze CORE's convergent validity with other well-known tests of g whose norms were established on general population samples to see whether these claims hold any merit.
5.1 Correlations with the AGCT
CORE demonstrates strong convergent validity with the Army General Classification Test (AGCT). As shown in Figure 6, within the CORE sample, CORE and AGCT scores correlate at r = .804 before correction and r = .844 after correction for indirect range restriction, showing substantial construct overlap between the two measures. This allows us to interpret the mean score differences in Figure 7.
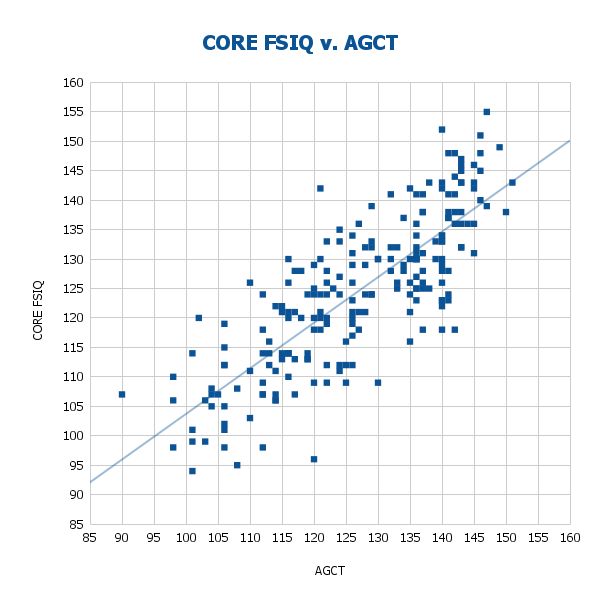
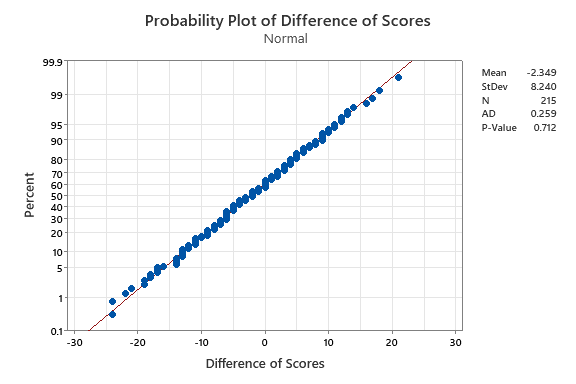
Mean score difference between CORE and the AGCT was -2.35 points (SD = 8.24), which is small and normally distributed. A mean difference of -2 points on an IQ scale (SD = 15) is tiny (≈0.16 SD), well within measurement error, and not practically significant.
5.2 Correlations with the GRE
CORE demonstrates strong convergent validity with the old GRE form on CognitiveMetrics. For the CORE sample, CORE and GRE composite scores correlate at r = .756 before correction and r = .858 after correction for indirect range restriction, showing substantial construct overlap between the two measures (Figure 8). The mean score differences are shown in Figure 9.
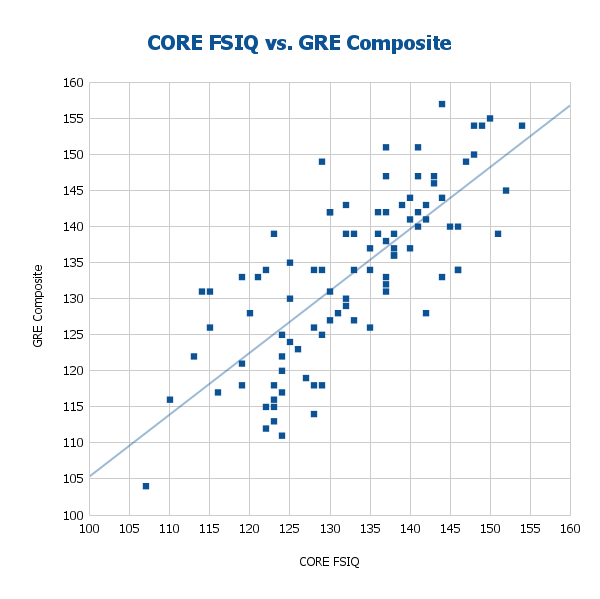
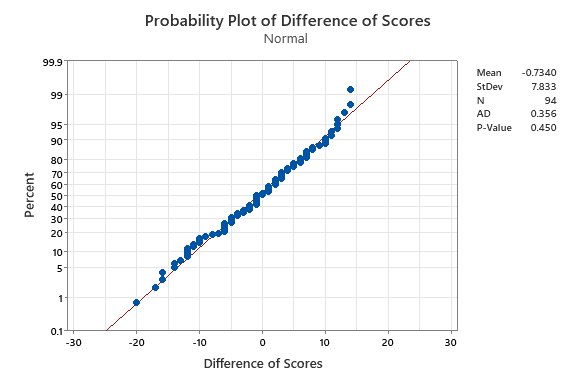
Mean score difference between CORE and the GRE was -0.73 points (SD = 7.83), which is small and normally distributed. Similar to the AGCT, these differences are well within measurement error and not practically significant.
5.3 Discussion
These findings indicate that, within this high-ability sample, CORE does not exhibit systematic inflation or deflation relative to the established measure. Descriptive statistics in Table 7 summarize the findings.
Table 7. Descriptive Statistics of Convergent Validity with AGCT and GRE
| Test | n | r | rRR | MeanCORE | SDCORE | MeanTest | SDTest |
|---|---|---|---|---|---|---|---|
| AGCT | 215 | 0.804 | 0.844 | 124.44 | 12.90 | 126.80 | 13.40 |
| GRE | 94 | 0.756 | 0.858 | 132.55 | 10.37 | 133.28 | 11.75 |
RR: corrected for indirect range restriction
6. Conclusions
Taken together, the findings presented in this report indicate that CORE is not just a “good online IQ test”, but a strong IQ test in general by professional standards. Across reliability, structural validity, model fit, and subtest g-loadings, CORE demonstrates properties that closely parallel those of established professional batteries, differing primarily through its online administration. While CORE is not intended as a clinical or diagnostic instrument, the evidence suggests that it provides a highly accurate and theoretically grounded estimate of general cognitive ability.
References
LaForte, E. M., Dailey, D., & McGrew, K. S. (2025). Technical Manual. Woodcock-Johnson V. Riverside Assessments, LLC.
Reynolds, M. R., Hajovsky, D. B., Niileksela, C. R., & Keith, T. Z. (2011). Spearman's law of diminishing returns and the DAS-II: Do g effects on subtest scores depend on the level of g? School Psychology Quarterly, 26(4), 275–289. https://doi.org/10.1037/a0026190
Reynolds, M. R. (2013). Interpreting the g loadings of intelligence test composite scores in light of Spearman’s law of diminishing returns. School Psychology Quarterly, 28(1), 63–76. https://doi.org/10.1037/spq0000013
Roid, G. H. (2003). Stanford-Binet Intelligence Scales, Fifth Edition, Technical Manual. Itasca, IL: Riverside Publishing.
Warne, R. T. (2025). Informational Bulletin for the Reasoning and Intelligence Online Test (RIOT Technical Report No. 2025-01). RIOT IQ.
Wechsler, D. (2008). Wechsler Adult Intelligence Scale - Fourth Edition Technical and Interpretive Manual. San Antonio, TX: Psychological Corporation.
Wechsler, D., Raiford, S. E., & Presnell, K. (2024). Wechsler Adult Intelligence Scale (5th ed.): Technical and interpretive manual. NCS Pearson.
Wilson, K. M. (1984). The relationship of GRE General Test item-type part scores to undergraduate grades. GRE Board Professional Report No. 81-22P. Princeton, NJ: Educational Testing Service.